
Matplotlib is a popular data visualization library in Python that provides high-quality 2D and 3D plots, graphs, and charts. It offers a wide range of customization options for creating visualizations that best suit your needs. One such customization is the ability to switch between a light and dark mode. In this article, we’ll explore how to use a dark theme in matplotlib and the benefits of doing so.
What is a Dark Theme?
A Dark mode is a display option that presents a darker color scheme than the default white or light background. It is becoming increasingly popular in many applications, including web browsers, operating systems, and software development environments. Dark mode can reduce eye strain, improve visibility in low-light environments, and save battery life on devices with OLED screens.
Why Use Dark Mode in Matplotlib?
Using dark mode in Matplotlib has several benefits:
- Improves visibility: Dark mode is easier on the eyes, especially in low-light environments. It can reduce eye strain and help prevent headaches and fatigue.
- Enhances contrast: Dark mode increases the contrast between the plotted data and the background, making it easier to distinguish between different data points.
- Saves battery life: On devices with OLED screens, dark mode can save battery life by reducing the amount of power needed to light up pixels.
- Aesthetically pleasing: Dark mode can give visualizations a modern and sleek look, making them more attractive and engaging.
How to Enable Dark Mode in Matplotlib
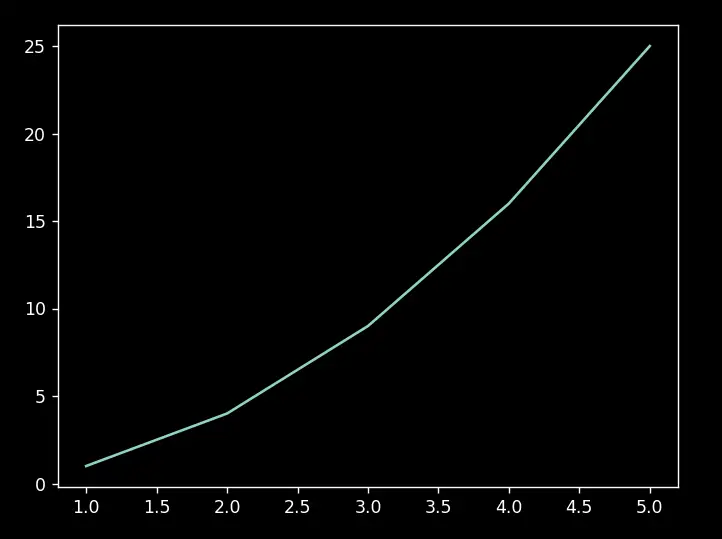
Matplotlib provides a built-in theme that can be used to enable dark mode. The plt.style.use() function can be used to set the theme for the entire script or notebook. The dark_background theme sets the background color to black and the foreground color to white, providing a dark mode theme.
import matplotlib.pyplot as plt

# enable dark mode
plt.style.use('dark_background')

# create a plot
x = [1, 2, 3, 4, 5]
y = [1, 4, 9, 16, 25]
plt.plot(x, y)

# show the plot
plt.show()
In case you want to build a system to toggle between styles, you can reset the styles back to the default by using the following command.
plt.style.use('default')
Sometimes you may want greater control over how the dark mode or theme is implemented, in which case, you can define your own styles. All you need to do is pass in a dictionary with the styles you wish to define, as shown below.
import matplotlib.pyplot as plt

# set custom parameters for the dark mode theme
plt.style.use({
    'axes.facecolor': '#1a1a1a',
    'axes.edgecolor': 'gray',
    'axes.labelcolor': 'white',
    'text.color': 'white',
    'xtick.color': 'tab:blue',
    'ytick.color': 'tab:blue',
    'grid.color': 'gray',
    'figure.facecolor': '#1a1a1a',
    'figure.edgecolor': '#1a1a1a',
    'savefig.facecolor': '#1a1a1a',
    'savefig.edgecolor': '#1a1a1a',
})

# create a plot
x = [1, 2, 3, 4, 5]
y = [1, 4, 9, 16, 25]
plt.plot(x, y)

# show the plot
plt.show()
This gives us the following output.
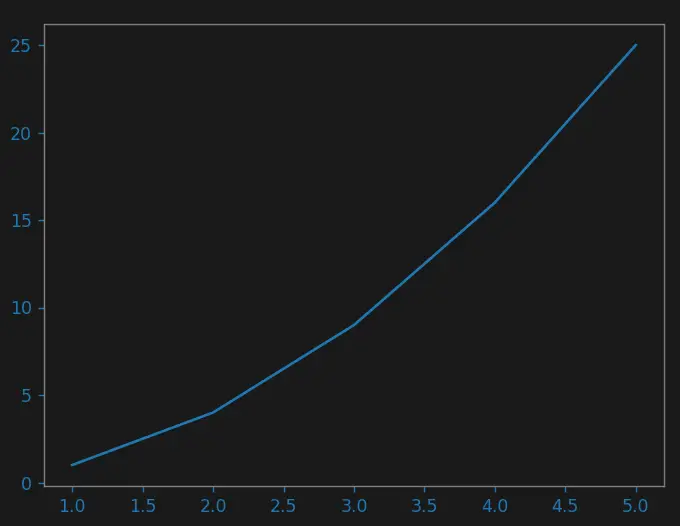
You can find a complete list of styles here, with a short description. Keep in mind that there are over hundreds of different styles. The ones we do not define are left at there default settings.
This marks the end of the “How to use Dark Theme in Matplotlib” Tutorial. Any suggestions or contributions for CodersLegacy are more than welcome. Questions regarding the tutorial content can be asked in the comments section below.