
In this tutorial we will explore how to display an image in matplotlib as “grayscale”. As the name implies, displaying as “grayscale” means removal of color, and having the image display only as black and white.
Converting Image to Grayscale with Pillow in Matplotlib
Matplotlib as a graphing library does not have the ability to display an image in grayscale. It can however, display a grayscale image that is given to it. So we will be using the Image Library in Python, Pillow, to convert the image to grayscale before handing it over to matplotlib.
We will try converting this image here to grayscale:

import numpy as np
import matplotlib.pyplot as plt
from PIL import Image
First make the required imports.
image = Image.open('image.png').convert("L")
Here we open the image in pillow, and convert it to grayscale. (The “L” specifies a grayscale conversion)
arr = np.asarray(image)
plt.imshow(arr, cmap='gray')
plt.show()
To use an image in matplotlib, it must be in the form of a numpy array. So we first convert the Pillow image to an array, then pass it into the imshow() function.
Finally, we display the image with plt.show().
Here is the complete code.
import numpy as np
import matplotlib.pyplot as plt
from PIL import Image

image = Image.open('image.png').convert("L")
arr = np.asarray(image)
plt.imshow(arr, cmap='gray', vmin=0, vmax=255)
plt.show()
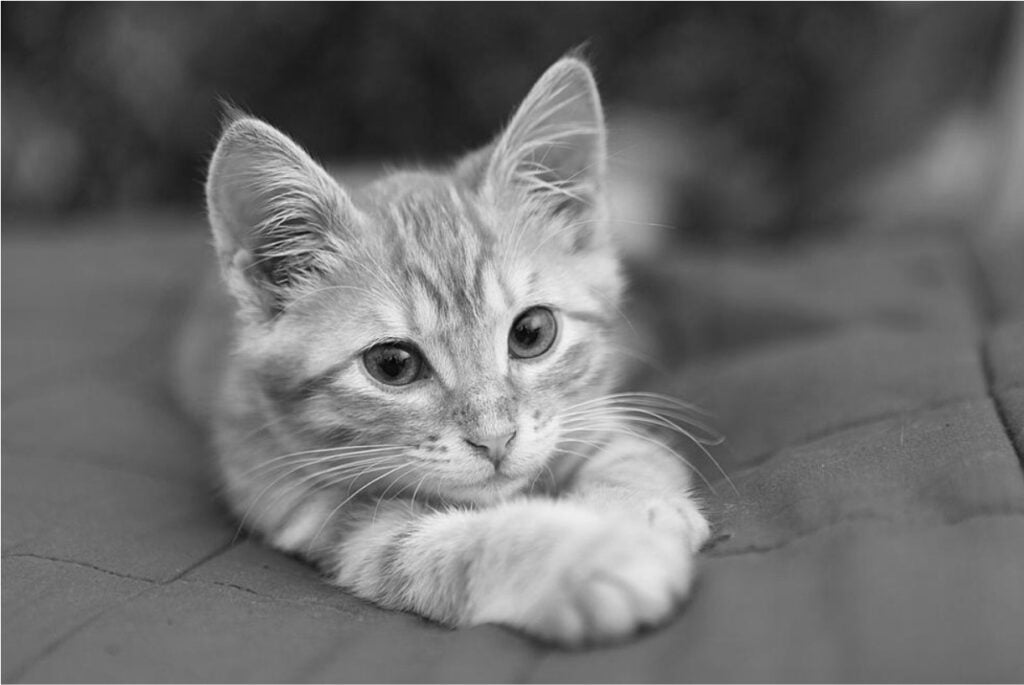
Here is the output of our image, but now its grayscale.
This marks the end of the Display Image as Grayscale in Matplotlib Tutorial. Any suggestions or contributions for CodersLegacy are more than welcome. Questions regarding the tutorial content can be asked in the comments section below.