
In this tutorial we will talk about plotting Shapely MultiPolygons with the Graphing Library Matplotlib. Unlike regular Shapley Polygons, there are a few extra things to keep in mind when plotting MultiPolygons.
Shapely MultiPolygons with Matplotlib
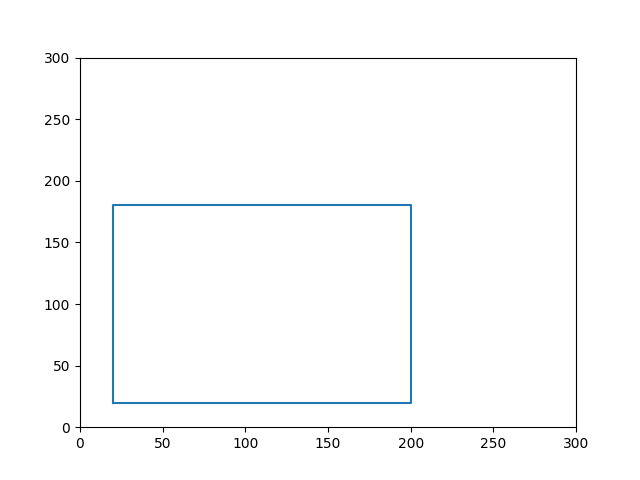
Here is a quick recap on how we plotted regular Polygons in Matplotlib. The exterior attribute can be used to retrieve the x and y values from the polygon, which we can then plug into the matplotlib ax.plot() function (or plt.plot()).
import matplotlib.pyplot as plt
from shapely.geometry import Polygon

fig, ax = plt.subplots()
poly = Polygon([(20, 20), (200, 20), (200, 180), (20, 180)])

x, y = poly.exterior.xy
ax.plot(x, y)
ax.axis([0, 300, 0, 300])
plt.show()
Now lets try using the same code for a Shapely MultiPolygon and see whether it works or not. Shown below is the Shapely MultiPolygon we will be using.
poly1 = Polygon([(20, 20), (40, 20), (40, 40), (20, 40)])
poly2 = Polygon([(50, 40), (80, 40), (65, 60)])
poly3 = Polygon([(20, 80), (60, 80), (60, 90), (20, 90)])
polygons = MultiPolygon([poly1, poly2, poly3])
Note: If you don’t know much about MultiPolygons, refer to this tutorial on Shapely MutliPolygons if you have any confusions (such as how we can create them).
Replacing the old Polygon with the MultiPolygon, and executing our code resulted in the following error:
AttributeError: 'MultiPolygon' object has no attribute 'exterior'This is because a MultiPolygon does not have a single “exterior”. In reality, a MultiPolygon is just a collection of Polygons. So instead what we have to do, is somehow each access Polygon and extract its exterior coordinates.
This is shown in the example code below. We will iterate over the MultiPolygon using the geoms attribute, and access the exterior attribute of each individual Polygon.
import matplotlib.pyplot as plt
from shapely.geometry import Polygon, MultiPolygon

fig, ax = plt.subplots()
poly1 = Polygon([(20, 20), (40, 20), (40, 40), (20, 40)])
poly2 = Polygon([(50, 40), (80, 40), (65, 60)])
poly3 = Polygon([(20, 80), (60, 80), (60, 90), (20, 90)])

polygons = MultiPolygon([poly1, poly2, poly3])

for poly in polygons.geoms:
    x,y=zip(*extract_coords(poly)[0])
    xi,yi=zip(*extract_coords(poly)[1])
    ax.plot(x, y, xi, yi)

ax.axis([0, 100, 0, 100])
plt.show()
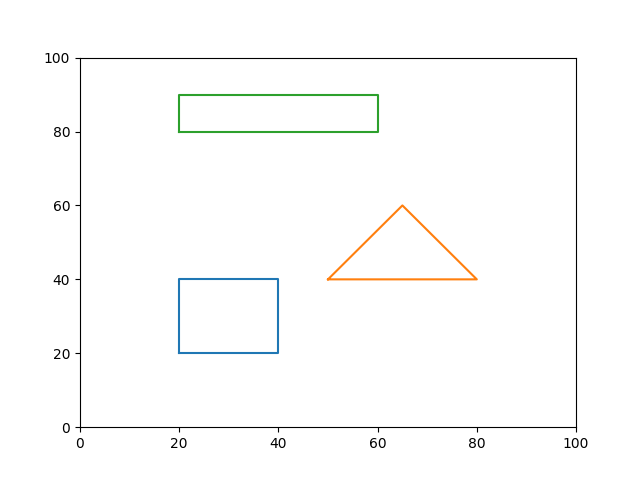
We now have the following output. (Pass a value into color parameter to make them all the same color if you want)
Plotting MutliPolygons with Interiors
The above technique will work just fine on regular Polygons, but will fail when it comes to Polygons with “interiors” or “holes” as they are often called in Shapely. Still don’t understand what this means? Just hold on a bit.
We need to tweak our code a bit to accommodate for both the “exterior” and the “interior” of the Polygon. This is shown in the example below.
import matplotlib.pyplot as plt
from shapely.geometry import Polygon, MultiPolygon

fig, ax = plt.subplots()
poly1 = Polygon([(20, 20), (40, 20), (40, 40), (20, 40)],
                holes=[[(30, 35), (25, 25), (35, 25)]])
poly2 = Polygon([(20, 80), (60, 80), (60, 90), (20, 90)])

def extract_coords(polygon):
    exterior_coords = polygon.exterior.coords[:]
    interior_coords = []
    for interior in polygon.interiors:
        interior_coords += interior.coords[:]
    return exterior_coords, interior_coords

polygons = MultiPolygon([poly1, poly2, poly2])

for poly in polygons.geoms:
    exterior, interior = extract_coords(poly)
    x, y = zip(*exterior)
    if poly.interiors:
        xi, yi = zip(*interior)
        ax.plot(x, y, xi, yi)
    else:
        ax.plot(x, y)

ax.axis([0, 100, 0, 100])
plt.show()
To make thing easier, we put some of the code in a separate function called extract_coords(). This function is incharge of retrieving the exterior and interior coordinates for a single Polygon. We then return this back to our main code, where we then plot the data (after converting the coordinates to an appropriate format of tuple pairs for x and y values using zip()).
Here is the final output.
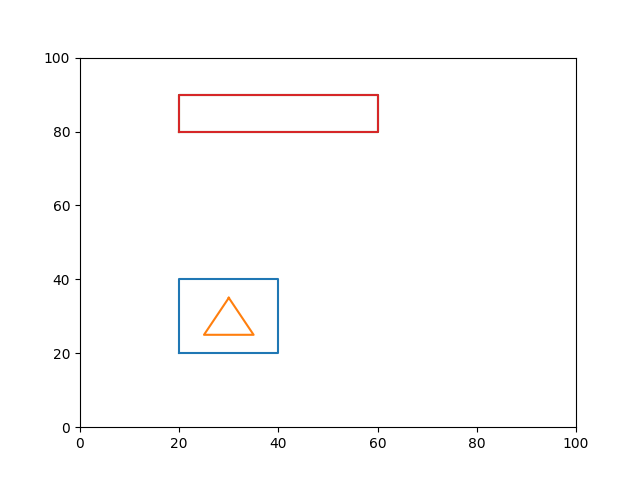
If the interiors don’t show up, then this most likely means you messed up the order of coordinates. The edges coordinates should be counter clockwise, whereas the interior coordinates need to be clockwise order. The starting point doesn’t really matter, so long as you follow the correct order.
This marks the end of the Plotting shapely MultiPolygons with Matplotlib Tutorial. Any suggestions or contributions for CodersLegacy are more than welcome. Questions regarding the tutorial content can be asked in the comments section below.