
In Python Matplotlib we can not only plot graphs and charts, but we can also “plot” or “display” an image as well! You can even plot multiple images, or plot a graph over the image if you want.
Plotting an Image
The first step to plotting an image is to actually load the image into our Python program. This can be done through a variety of methods, out of which imread() is the most common. This function takes an image file path and returns the image data for that image for us to use.
import matplotlib.pyplot as plt

img = plt.imread("quiverplot.png")
The next step is to create a figure and the axes using subplots(). The figure represents the Window in which we will be displaying our image, and the axes represents the x-axis and y-axis.
fig, ax = plt.subplots()
To actually draw the image to the figure, we need to call the imshow() method on the axes object.
img = ax.imshow(img)
The image has been drawn, but the window is not currently being displayed. For this we need to call the following function:
plt.show()
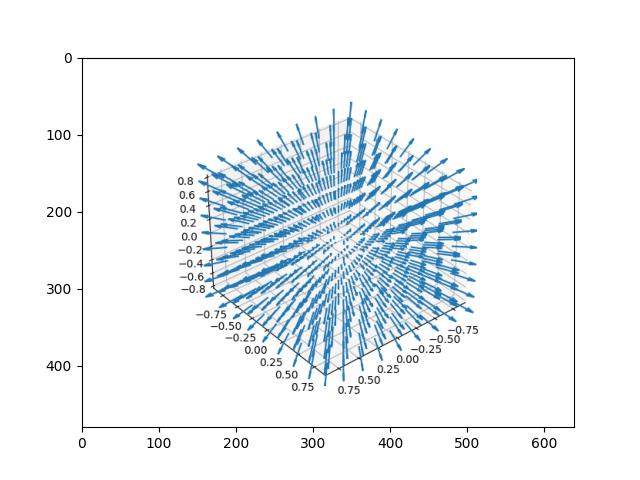
We get the following output: (We plotted an image of a 3D quiver-plot)
By default, the Axis will adjust to the image dimensions. Another interesting thing you can do is re-size the image in the imshow() function.
img = ax.imshow(img, extent = [0, 200, 0, 200])
Try running this code yourself to see how it effects the image!
Plot a graph over an Image
You can plot multiple things on to a single figure, such as multiple plots, multiple images or even a mix of images and plots.
Let’s take a look at a small example.
import matplotlib.pyplot as plt
import numpy as np

img = plt.imread("quiverplot.png")

fig, ax = plt.subplots()
img = ax.imshow(img, extent = [0, 200, 0, 200])

x = np.arange(0, 200, 1)
y1 = np.arange(0, 200, 1)
y2 = np.arange(200, 0, -1)

plt.plot(x, y1)
plt.plot(x, y2)
plt.show()
The output:

This marks the end of the How to Plot an image in Python Matplotlib Tutorial. Any suggestions or contributions for CodersLegacy are more than welcome. Questions regarding the tutorial content can be asked in the comments section below.