An article on the use the Python Matplotlib Histogram followed by several examples.
What is a Histogram?
A Python Matplotlib Histogram is able to graphically summarize the distribution of a data set. The keyword here is distribution. A Histogram can also taught of as a frequency table, that records the number of times a value falls within a certain interval (class interval.)
Histogram Example
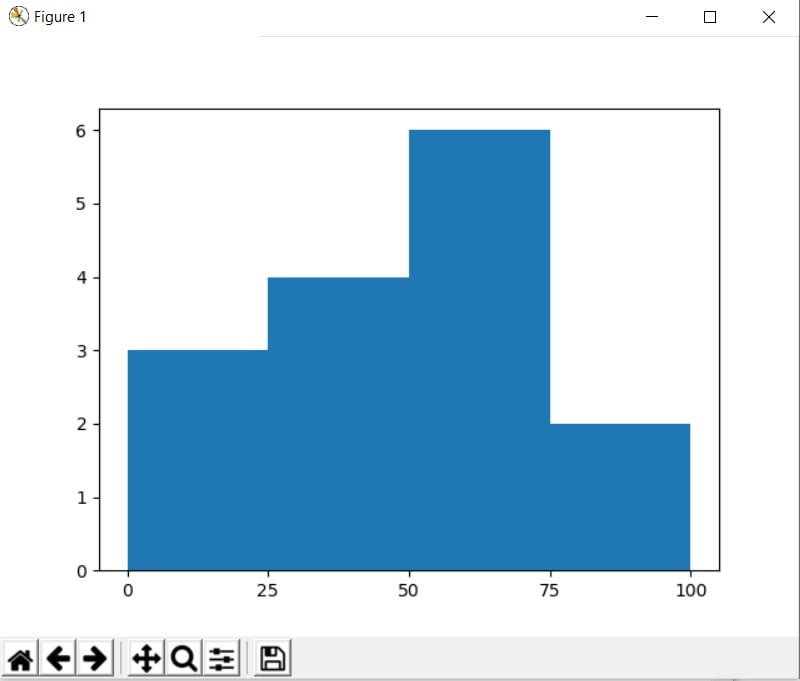
We start of by creating the standard object stored in ax. Next we create a data set to be used in the Histogram stored in values. Finally, using the hist() function we create the graph. Through the use of the bins parameter, we set up the class intervals for the Histogram. The set_ticks sets the values on the x-axis. To finish, we use the show() function to display the Histogram on screen.
from matplotlib import pyplot as plt

fig = plt.figure()
ax = fig.subplots(1,1)

#Values for Histograms
values = [5,43,66,85,35,54,74,23,53,97,54,24,55,34,32]

#Creating histogram and defining class intervals
ax.hist(values, bins = [0,25,50,75,100])
ax.set_xticks([0,25,50,75,100])

plt.show()

Customizing Histograms
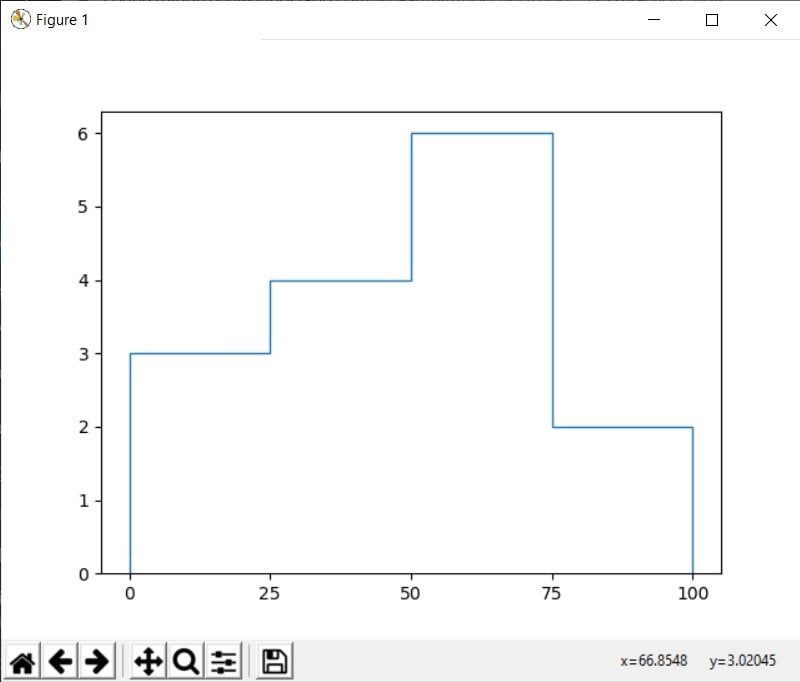
One of the few customizations available is the histtype parameter. You can change the style in which the Histogram is shown by adjusting this parameter. It’s default value is 'bar'.
from matplotlib import pyplot as plt

fig = plt.figure()
ax = fig.subplots(1,1)
values = [5,43,66,85,35,54,74,23,53,97,54,24,55,34,32]
ax.hist(values, bins = [0,25,50,75,100], histtype = 'step')
ax.set_xticks([0,25,50,75,100])
plt.show()

Here’s a link back to the main Python Matplotlib section, where you can learn about all the other different types of graphs you can make.
This marks the end of our Python Matplotlib Histogram Tutorial. Any suggestions or contributions for CodersLegacy are more than welcome. Questions regarding the article content can be asked in the comments section below.
