In this Matplotlib Tutorial, we will explore how we can create a Quiver Plot with pyplot.
A Quiver Plot is a 2D representation of vectors. A Vector comprises of two attributes, a magnitude and direction. The primary purpose of the Quiver Plot is to visualize data which requires a direction, such as magnetic and electric fields.
Plotting Vectors in Matplotlib
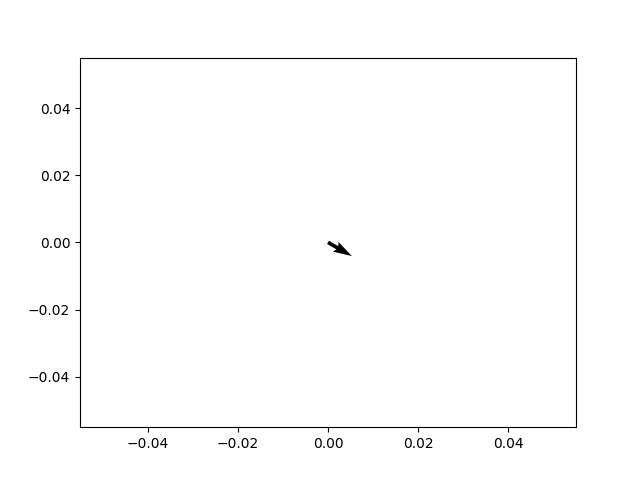
Let’s start off simply plotting a single vector. To do so, we need 4 values. We need the x and y coordinates, which represent the origin position of the vector. We also need the u and v values which control the arrow direction (u for x-axis, v for y-axis).
Now we just pass these 4 values into the quiver() function, and we have our quiver plot!
import matplotlib.pyplot as plt

fig = plt.figure()
ax = plt.axes()

x = 0
y = 0
u = 7
v = -4

q = ax.quiver(x, y, u, v)
plt.show()

The quiver() function can be called in various ways. In the above example we called it as a method of the ax object. We can also call it as a method of pyplot, like plt.quiver().
Plotting Multiple Vectors
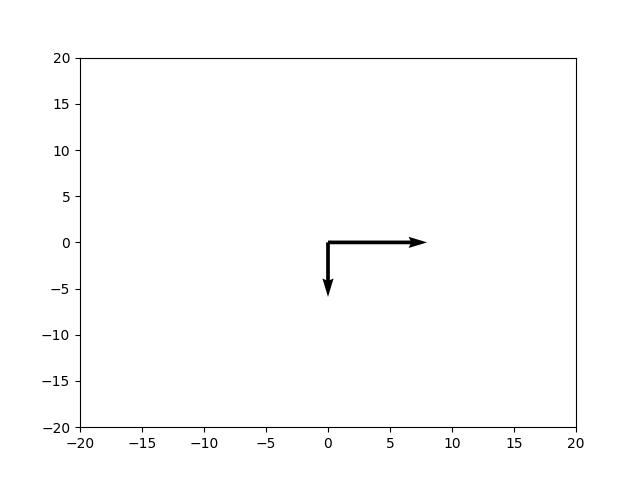
Now let’s take a look at plotting two vectors at the same time. Using single variables to store a single integer is not a good idea obviously (as our plot becomes bigger), so we begin using arrays instead.
We also made some new additions to our code. This time we explicitly define the x-axis and y-axis scales, from -20 to 20 using set_xlim() and set_ylim(). (Normally it scales automatically based off the data)
We have also used the scale parameter in the quiver() function to increase the size of our vectors. Be careful not to put a very low value, as it will make the Vectors very large. (The scale parameter controls the density of units per area) A larger value results in a smaller sized vector.
import matplotlib.pyplot as plt

#define plots
fig, ax = plt.subplots()
ax.set_xlim(-20, 20)
ax.set_ylim(-20, 20)

#define coordinates and directions
x = [0, 0]
y = [0, 0]
u = [0, 20]
v = [-11, 0]

#create quiver plot
ax.quiver(x, y, u, v, scale = 100)

#display quiver plot
plt.show()
The output:

Quiver Plots in Matplotlib
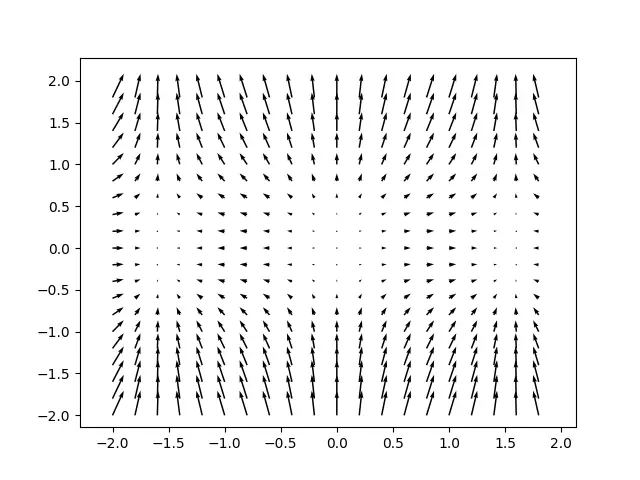
Here is the first proper example for Quiver Plots. We will be plotting a large-scale Quiver Plot using some data we generated using the NumPy Library.
To create the data we used np.meshgrid(), which is commonly used to generate a grid of data using arrays as parameters. To understand this point carefully, check out the output, and notice how there are so many vectors despite us only defining around 20 values for both the x-axis and y-axis each.
import matplotlib.pyplot as plt
import numpy as np

#define plots
fig, ax = plt.subplots()

#define coordinates and directions
x,y = np.meshgrid(np.arange(-2, 2, 0.2), np.arange(-2, 2, 0.2))
u = np.cos(x)*x
v = np.sin(y)*y

#create quiver plot
ax.quiver(x, y, u, v)

#display quiver plot
plt.show()

If you have trouble viewing the graph, or it’s not appearing centered for you, then define the following limits. This will adjust the y-axis and x-axis to match our dataset.
ax.set_xlim(-2.2, 2.2)
ax.set_ylim(-2.2, 2.2)
How to make a 3D Quiver Plot
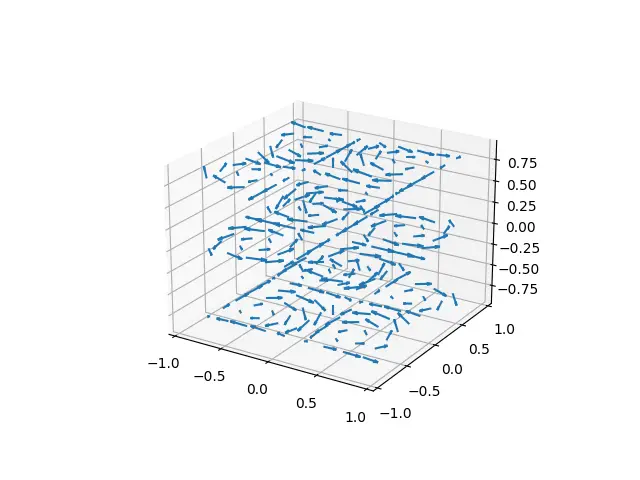
You are not restricted to just two dimensions when working with Quiver Plots. You can also represent 3D Vectors using 3D Quiver Plots in Matplotlib.
The syntax remains very similar. You just need to acquire/create data for an additional z parameter (z-axis), and it’s corresponding direction (which we represented with w).
import matplotlib.pyplot as plt
import numpy as np

# Coordinates (x,y,z)
x, y, z = np.meshgrid(np.arange(-0.8, 1, 0.2),
                      np.arange(-0.8, 1, 0.2),
                      np.arange(-0.8, 1, 0.8))

# Direction of the Arrows (vectors)
u = np.sin(np.pi * x) * np.cos(np.pi * y) * np.cos(np.pi * z)
v = -np.cos(np.pi * x) * np.sin(np.pi * y) * np.cos(np.pi * z)
w = (np.sqrt(2.0 / 3.0) * np.cos(np.pi * x) * np.cos(np.pi * y) *
     np.sin(np.pi * z))

fig = plt.figure()
ax = plt.axes(projection = "3d")

q = ax.quiver(x,y,z,u,v,w, length = 0.25)
plt.show()
Two other minor changes include using projection = "3d" as an argument when creating the axes for the figure. This specifies that the axes should be in 3D.
Another handy feature is the length parameter (only works on 3D Plots for me), which can be used to specify the length of each arrow in the plot.

This marks the end of the Matplotlib Quiver Plot with pyplot Tutorial. Any suggestions or contributions for CodersLegacy are more than welcome. Questions regarding the tutorial content can be asked in the comments section below.
