In this Python tutorial we will explore how to create a 3D Quiver Plot.
Quiver Plots are used to represent data that requires a direction. For example, electric and magnetic fields comprise of many individual vectors each with their own direction. The Matplotlib Quiver Plot is used to plot these individual vectors and construct the entire field/flow.
Usually Quiver Plots are constructed with 2D Vectors, in which case a 2D Quiver Plot is used. In this tutorial however, we will explore using a 3D Quiver Plot with 3D Vectors.
3D Quiver Plot with Matplotlib
In this tutorial we will making use of a powerful graphing library with built-in support for Quiver Plots called Matplotlib.
Before we begin plotting, we first need some data. Since this is just an example, we will be generating some random data using the numpy library. You may already have some data from some other source, such as Wind Data (direction and velocity) or Electronic/Magnetic Field Data.
# Coordinates (x,y,z)
x, y, z = np.meshgrid(np.arange(-0.8, 1, 0.2),
                      np.arange(-0.8, 1, 0.2),
                      np.arange(-0.8, 1, 0.2))
Using the arange() function from numpy, we generated data from -0.8 to 1 with intervals of 0.2. This gives us the coordinates for each vector we intend to plot. But along with the coordinates, we also need the vector direction (it’s orientation in the x, y and z axis).
# Direction of the Arrows (vectors)
u = np.sin(x)
v = np.sin(y)
w = np.sin(z)
To do this we simply applied the sin() function on each value in the x, y and z coordinate arrays. This will lead to some interesting looking data!
fig = plt.figure()
ax = plt.axes(projection = "3d")
After that, we need to create the figure (the window) and the axis (x and y). Make sure to include the “3d” parameter, in order to specify that we are making a 3D quiver plot, not a 2D one.
q = ax.quiver(x,y,z,u,v,w, length = 0.25)
plt.show()
Finally we pass all the arrays into the quiver() function, and specify a length of 0.25 for each vector. (Default size can be pretty big). Calling plt.show() will display the plot.
Here is the compiled code.
import matplotlib.pyplot as plt
import numpy as np

# Coordinates (x,y,z)
x, y, z = np.meshgrid(np.arange(-0.8, 1, 0.2),
                      np.arange(-0.8, 1, 0.2),
                      np.arange(-0.8, 1, 0.2))

# Direction of the Arrows (vectors)
u = np.sin(x)
v = np.sin(y)
w = np.sin(z)

fig = plt.figure()
ax = plt.axes(projection = "3d")

q = ax.quiver(x,y,z,u,v,w, length = 0.25)
plt.show()
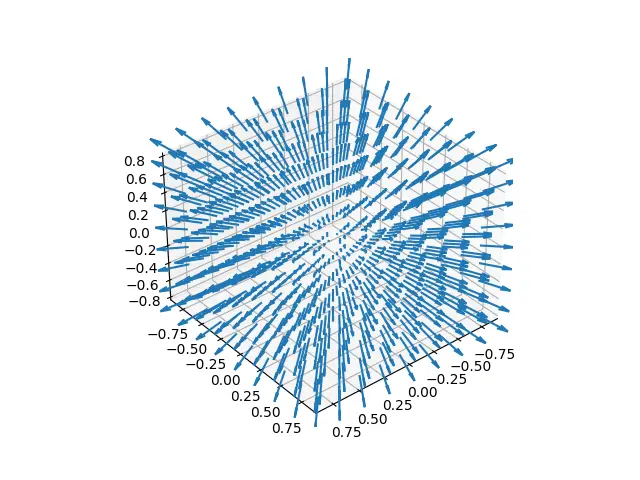
And here is the output! Looks very interesting doesn’t it?

If you run this code for yourself, you will notice you can rotate this graph in all three dimensions. This allows you to view it from different angles.
3D Quiver Plot Example
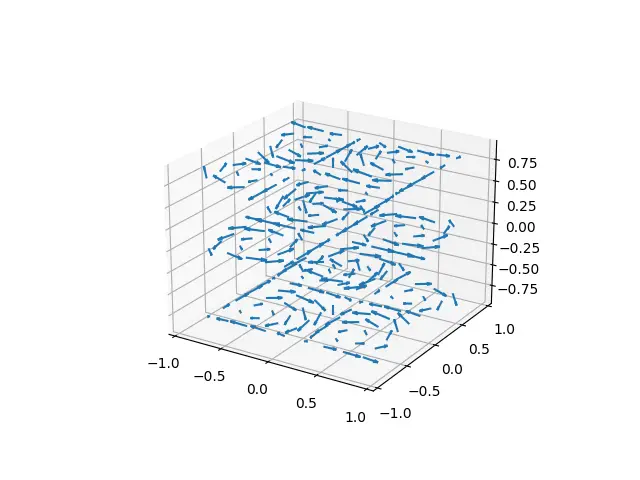
Here is another example for a 3D Quiver Plot. This one is from the official matplotlib documentation.
import matplotlib.pyplot as plt
import numpy as np

# Coordinates (x,y,z)
x, y, z = np.meshgrid(np.arange(-0.8, 1, 0.2),
                      np.arange(-0.8, 1, 0.2),
                      np.arange(-0.8, 1, 0.8))

# Direction of the Arrows (vectors)
u = np.sin(np.pi * x) * np.cos(np.pi * y) * np.cos(np.pi * z)
v = -np.cos(np.pi * x) * np.sin(np.pi * y) * np.cos(np.pi * z)
w = (np.sqrt(2.0 / 3.0) * np.cos(np.pi * x) * np.cos(np.pi * y) *
     np.sin(np.pi * z))

fig = plt.figure()
ax = plt.axes(projection = "3d")

q = ax.quiver(x,y,z,u,v,w, length = 0.25)
plt.show()
There isn’t really anything new being used in this code. Just observe the output and notice what kind of graphs can be plotted using Quiver Plots.

If you look closely, you will notice that there is a repeating pattern of circles, formed by many little arrows.
This marks the end of the Python 3D Quiver Plot Tutorial. Any suggestions or contributions for CodersLegacy are more than welcome. Questions regarding the tutorial content can be asked in the comments section below.
