
The Matplotlib Patches module gives us the ability to plot a variety of different shapes such as Rectangles, Circles, Ellipses and other types of Polygons. This tutorial will be about drawing and customizing these shapes in our Matplotlib Window.
Drawing Basic Shapes with Patches
As we mentioned earlier, the patches module has built-in Classes for most of the basic shapes. Lets discuss each one of them with a code example and its output. We will be importing each of these Classes in the following manner.
from matplotlib.patches import RectangleRectangle
The rectangle class takes three main parameters. The syntax for this is shown below.
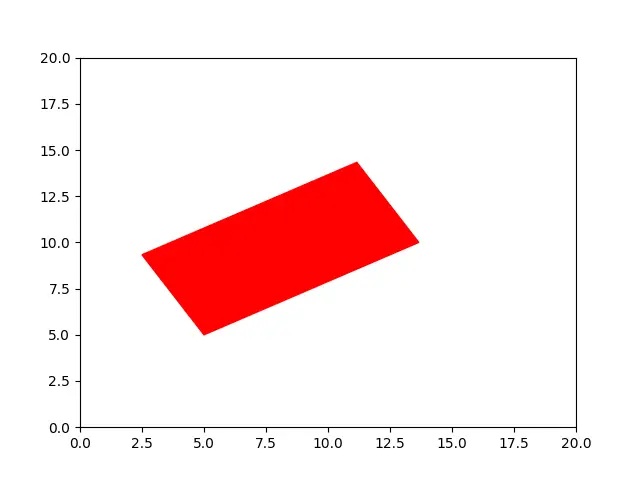
Rectangle(center, width, height, **kwargs)center is a tuple containing two values (x and y) which specify the origin point. The other two parameters are fairly self-explanatory. There are a few other interesting options like angle (used to rotate the rectangle) and color that we can also use.
Here is a simple example showing how to plots rectangles in Matplotlib with a few customizations applied.
import matplotlib.pyplot as plt
from matplotlib.patches import Rectangle

#     +------------------+
#     |                  |
#   height               |
#     |                  |
#   (x,y)---- width -----+

fig, ax = plt.subplots()
ax.axis([0, 20, 0, 20])

shape = Rectangle((5, 5),
                   width=10,
                   height=5,
                   angle=30,
                   color="Red")
ax.add_patch(shape)
plt.show()
You can also make the rectangle “hollow” by turning off the fill parameter (default value is true). We can try this parameter out for the next shape. (This parameter works on pretty much every shape in matplotlib)
Circle
Now lets try plotting a circle. The syntax for all these shapes is actually pretty similar.
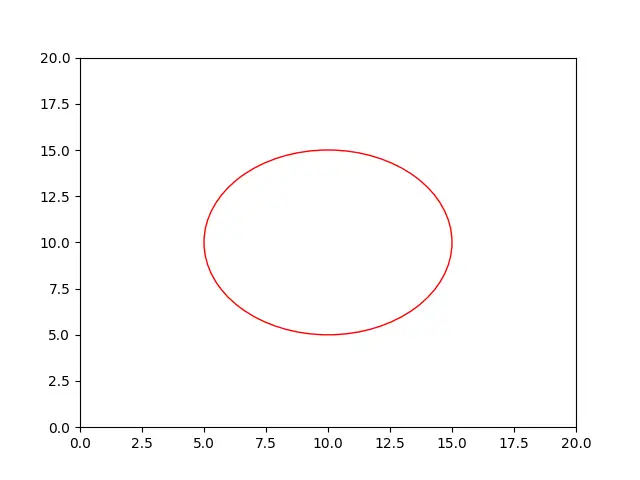
Circle(center, radius, **kwargs)Once again, we have the first parameter as the center, followed by the radius which controls the size of the Circle. Other optional parameters are also available which we will discuss in the below image. (Bear in mind that most parameters like these are common across all shapes)
Lets code a short example, and take a look at the output.
import matplotlib.pyplot as plt
from matplotlib.patches import Circle

fig, ax = plt.subplots()
ax.axis([0, 20, 0, 20])

shape = Circle((10, 10),
                radius=5,
                fill=False,
                edgecolor="red")
ax.add_patch(shape)
plt.show()
Ellipse
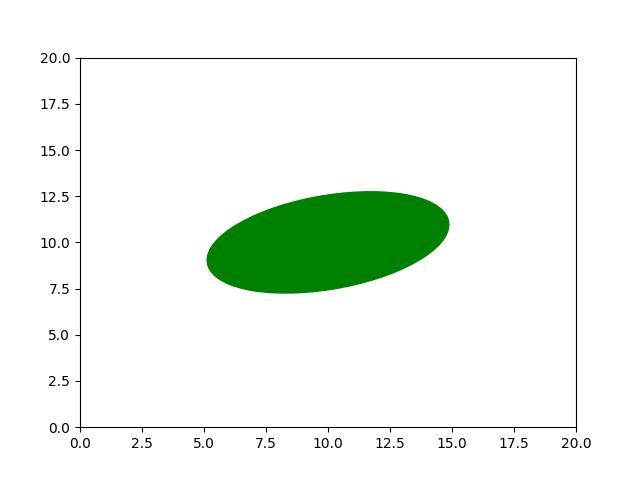
The Ellipse Class is actually the parent class for Circle. Despite that, its parameters are identical to that of the Rectangle Class as we can see below.
Ellipse(center, width, height, **kwargs)Now for a short example.
import matplotlib.pyplot as plt
from matplotlib.patches import Ellipse

fig, ax = plt.subplots()
ax.axis([0, 20, 0, 20])

shape = Ellipse((10, 10),
                width=10,
                height=5,
                angle=15,
                color="Green")

ax.add_patch(shape)
plt.show()
Regular Polygon
A regular polygon can be used to create a wide variety of shapes. There are no classes for certain popular shapes, such as Triangles, Pentagons, Hexagons and Octagons. But that does not mean we cannot create them.
RegularPolygon(center, numVertices, radius, **kwargs)The first and third parameters you should already be familiar with by now. The second parameter controls what type of polygons is generated. In simpler words, it defines the number of edges/vertices.
If you want a triangle, pass in 3. For a Pentagon, pass in 5.
Let us try a few sample programs.
import matplotlib.pyplot as plt
from matplotlib.patches import RegularPolygon

fig, ax = plt.subplots()
ax.axis([0, 20, 0, 20])

shape = RegularPolygon((10, 10),
                        numVertices=3,
                        radius=5,
                        facecolor="purple",
                        edgecolor="blue")

ax.add_patch(shape)
plt.show()
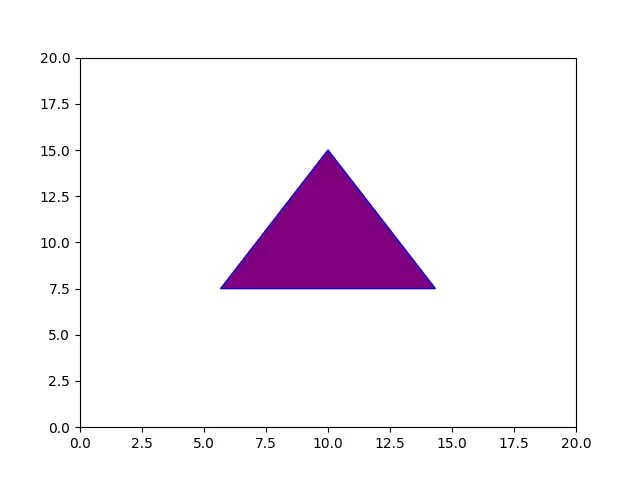
facecolor and edgecolor are two other useful parameters. Facecolor sets the color within the boundaries of the shape, whereas edgecolor controls the color of the border.
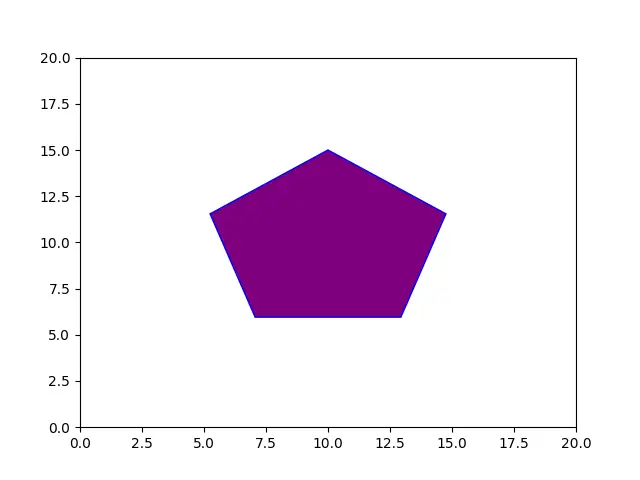
Lets try one more example with the number of vertices changed to 5.
shape = RegularPolygon((10, 10),
                        numVertices=5,
                        radius=5,
                        facecolor="purple",
                        edgecolor="blue")
Polygon
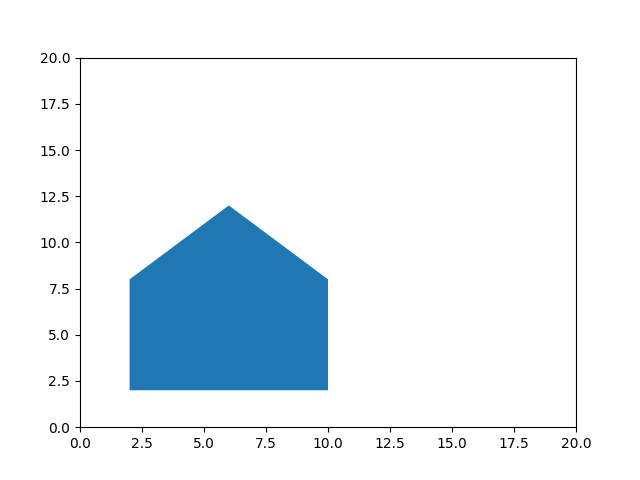
This is rather similar to the Regular Polygon, but alot more flexible. We can actually pass in our own set of coordinates here, and have a Polygon based of those coordinates drawn to the window.
This Class takes just a single compulsory parameter, in the form of 2xN (where n is the number of coordinate pairs) numpy array.
Here is an example.
import matplotlib.pyplot as plt
from matplotlib.patches import Polygon
import numpy as np

fig, ax = plt.subplots()
ax.axis([0, 20, 0, 20])

array = np.array(((2,2), (2,8), (6,12), (10,8), (10,2)))
shape = Polygon(array)

ax.add_patch(shape)
plt.show()
This marks the end of the Drawing Shapes with Matplotlib Patches Tutorial. Any suggestions or contributions for CodersLegacy are more than welcome. Questions regarding the tutorial content can be asked in the comments section below.