
When drawing and plotting complex Matplotlib Graphs, we often need the help of “Annotations”. These are arrows and text labels used to label parts of the graphs to give it more meaning. This tutorial is about how we can customize the properties, also known as arrowprops, of these arrows and labels in Matplotlib.
Matplotlib Annotation
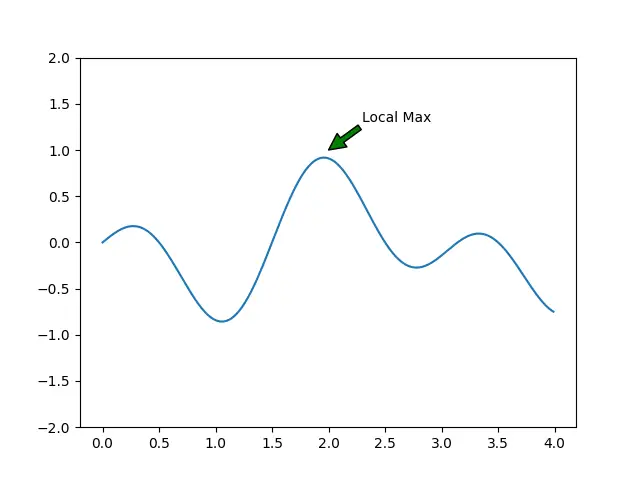
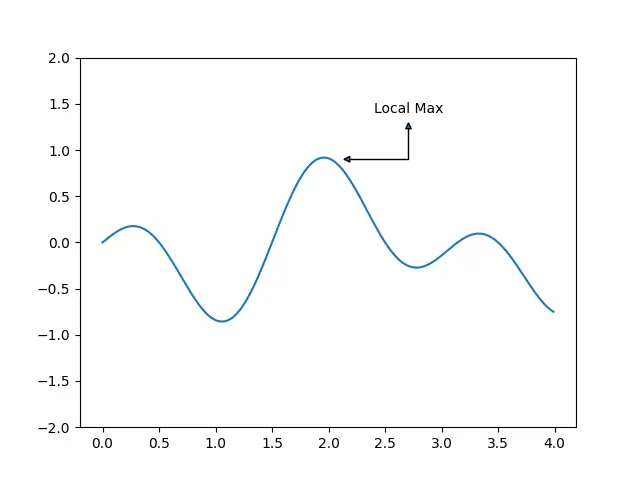
Here we have made a small matplotlib program that plots a simple graph with some annotation. Over the course of this tutorial, we will be customizing the arrow and annotation properties to modify its look.
import matplotlib.pyplot as plt
import numpy as np

fig, ax = plt.subplots()

x = np.arange(0.0, 4.0, 0.01)
y = np.cos(np.pi * x) * np.sin(x)

ax.annotate('Local Max',
            xy =(2, 1),
            xytext =(2.3, 1.3),
            arrowprops =dict(facecolor='green'))

ax.set_ylim(-2, 2)
plt.plot(x, y)
plt.show()
Matplotlib arrowprops
arrowprops is a parameter in the annotate() function that takes a dictionary of key-value pairs. Each dictionary in this key represents an option. Below we have listed 12 of the most useful options with a short description.
facecolor:Internal color of the arrow, not including the bordersedgecolor:Defines the color of the edges (borders)color:Overall color (facecolor + edgecolor)linewidth:Border width (using 0 will make edges disappear)shrink:Ranges from 0 to 1. Increasing this value reduces the space occupied by the arrow between the text and point.visible:Can be used to hide the arrowheadwidth:Changes the width of the arrow head.headlength:Changes the length of the arrow head.width:Changes the width of the arrow shaft.alpha:Ranges from 0 to 1. Sets the transparency.arrowstyle:changes the arrow head styleconnectionstyle:Used to change the style of the arrow (curved, angled, etc.)
We will be showing you how to use these 12 options across several examples.
Matplotlib arrowprops example#1
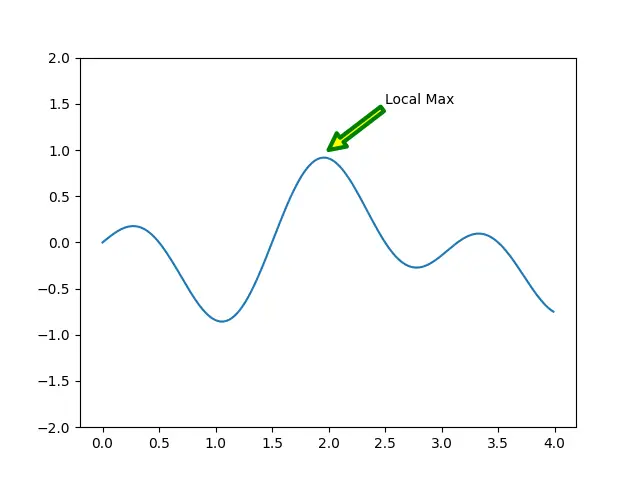
This examples features three properties. Facecolor defines the internal color, whereas edgecolor defines the colors of the borders. linewidth value has been increased from its default value to make the borders more prominent (thicker).
ax.annotate('Local Max',
            xy =(2, 1),
            xytext =(2.5, 1.5),
            arrowprops =dict(facecolor="yellow",
                             edgecolor="green",
                             linewidth=3))
Matplotlib arrowprops example#2
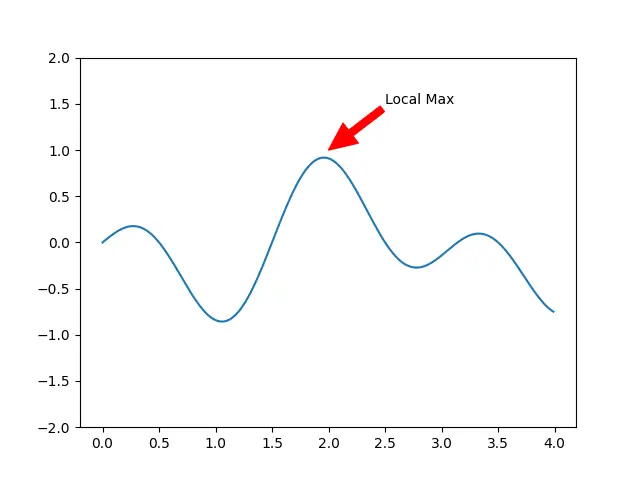
Here we have used color, which has made the whole arrow (edges and the inside) red. This time we wanted a larger arrow, so we increased the headwidth and headlength, along with the width of the line (which is controlled by width)
ax.annotate('Local Max',
            xy =(2, 1),
            xytext =(2.5, 1.5),
            arrowprops =dict(color="red",
                             headwidth=18,
                             headlength=20,
                             width=5))
Matplotlib arrowprops example#3
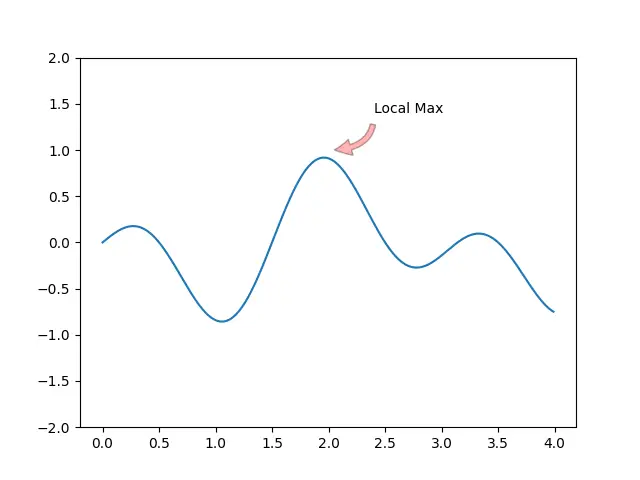
Here we have used shrink, which isn’t very noticeable, but it “shrinks” the arrow a bit. Do not raise the value of this too much, otherwise it will look rather odd. We usually just use 0.05 or 0.1 to add in some small padding.
We have also used alpha, we gives us a more transparent arrow. Lower values mean higher transparency. A value of 1 means fully opaque, whereas 0 is fully transparent.
This example also features connectionstyle, which we have set as “angle3”. Possible values are “angle”, “angle3”, “arc”, “arc3” and “bar”. The “angle3” setting creates a curved arrow as shown below.
ax.annotate('Local Max',
            xy =(2, 1),
            xytext =(2.4, 1.4),
            arrowprops =dict(facecolor="red",
                             shrink=0.1,
                             alpha=0.3,
                             connectionstyle="angle3"))
Matplotlib arrowprops example#4
Here we have used visible (just to show you where and how it is used). You can set it to False if you want it to disappear for a while. You can modify its value during the execution of your program later.
We have also used arrowstyle here, which controls the type of arrowheads that appear. Possible values are “<-“, “->”, “<->”, “<|-|>”, “-|>”, “<|-“, “fancy”, “simple” and “wedge”.
ax.annotate('Local Max',
            xy =(2.1, 0.9),
            xytext =(2.4, 1.4),
            arrowprops =dict(visible=True,
                             arrowstyle="<|-|>",
                             connectionstyle="angle"))
You can’t use facecolor or edgecolor with (most) Arrowstyles, but you can use color.
How to change Arrowprops after initialization?
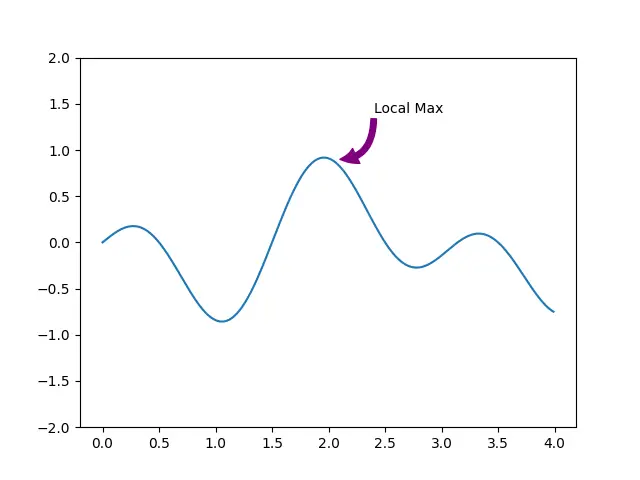
Often during the program execution we will want to modify our Arrowprops. This can easily be done as long as we save the return object from the annotate() function. This return object represents the arrow, upon which we can then perform various methods to change its properties.
Every arrow/annotate object has an arrow_patch attribute, which we can access to change the arrowprops. If you want to change the color, we will use the set_color() method on arrow_patch. If we want to change the connectionstyle, we call the set_connectionstyle() method on it. To modify other properties as well, simply do set_ + propertyname(). (It may not work for all properties though)
from django.db import connection
import matplotlib.pyplot as plt
import numpy as np

fig, ax = plt.subplots()

x = np.arange(0.0, 4.0, 0.01)
y = np.cos(np.pi * x) * np.sin(x)

arrow = ax.annotate('Local Max',
              xy =(2.1, 0.9),
              xytext =(2.4, 1.4),
              arrowprops = dict())

arrow.arrow_patch.set_connectionstyle(("angle3"))
arrow.arrow_patch.set_color(("purple"))

ax.set_ylim(-2, 2)
plt.plot(x, y)
plt.show()
This marks the end of the How to change arrowprops in Matplotlib Tutorial. Any suggestions or contributions for CodersLegacy are more than welcome. Questions regarding the tutorial content can be asked in the comments section below.