
When drawing large and complex Plots in Matplotlib, we need a way of labelling certain portion or points of interest on the graph. To do so, Matplotlib provides us with the “Annotation” feature which allows us to plot arrows and text labels on the graphs to give them more meaning.
In this tutorial we will discuss various examples in which we “annotate” our Matplotlib plots, using a variety of different arrow types and configurations.
Basic Arrow and Text Annotation in Matplotlib
We will be using the annotate() function extensively in this tutorial. This function can be highly customized with various parameters and settings. Even its parameters have parameters of their own!
There are 4 important parameters that you must always use with annotate().
text:This defines the text label. Takes a string as a value.xy:The place where you want your arrowhead to point to. In other words, the place you want to annotate. This is a tuple containing two values,xandy.xytext:The coordinates for where you want to text to display.arrowprops:A dictionary of key-value pairs which define various properties for the arrow, such as color, size and arrowhead type.
Now using this knowledge, lets code a simple example using annotation in matplotlib.
import matplotlib.pyplot as plt
import numpy as np
fig, ax = plt.subplots()
x = np.arange(0.0, 5.0, 0.01)
y = np.sin(2*np.pi * x)
# Annotation
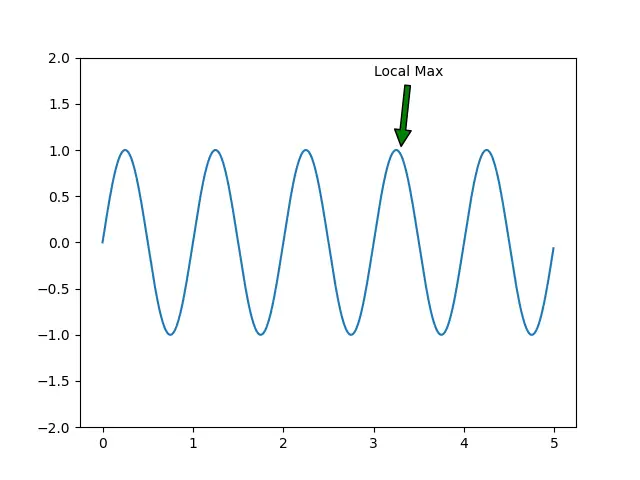
ax.annotate('Local Max',
xy =(3.3, 1),
xytext =(3, 1.8),
arrowprops = dict(facecolor ='green',
shrink = 0.05))
ax.set_ylim(-2, 2)
plt.plot(x, y)
plt.show()
The facecolor option in arrowprops defines the color of the arrow (excluding the edges). You can use edgecolor to decide the color for the edges (default is black). The shrink parameter is just being used to shrink the arrow a little for some space/padding.
Executing the above code gives us the following output:
Matplotlib Annotation Example#2
Now lets trying plotting more than just one. This is easily possible because the annotate() function can be used repeatedly to create more than one annotation on a single plot.
import matplotlib.pyplot as plt
import numpy as np
fig, ax = plt.subplots()
x = np.arange(0.0, 5.0, 0.01)
y = np.sin(2*np.pi * x)
# Annotation
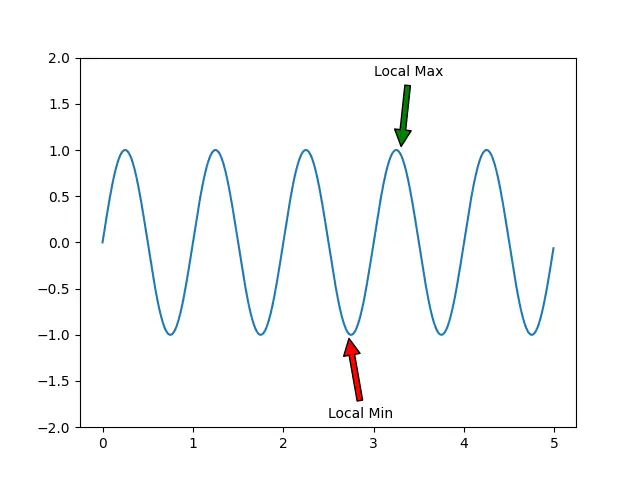
ax.annotate('Local Max',
xy =(3.3, 1),
xytext =(3, 1.8),
arrowprops = dict(facecolor ='green',
shrink = 0.05))
ax.annotate('Local Min',
xy =(2.72, -1),
xytext =(2.5, -1.9),
arrowprops = dict(facecolor ="red",
shrink = 0.05))
ax.set_ylim(-2, 2)
plt.plot(x, y)
plt.show()
We now have two annotations, one pointing to a maximum value, and one pointing to a minimum value.
Lets take a look at how we can further customize our arrows using more arrowprops options.
Arrow Styles Annotations in Matplotlib
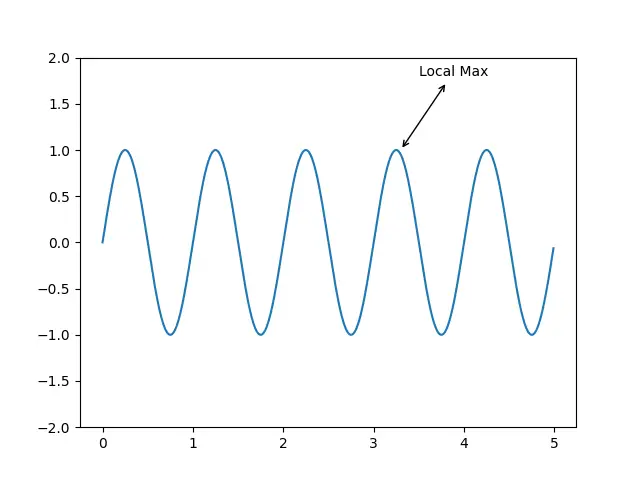
One of the important parameters in arrowprops is called arrowstyles. This parameter controls various aspects of the arrow that joins the “point of interest” and the “text label”. We can use it to modify the arrowhead and how the line is drawn (curved, angled or straight)
Here we change the arrowstyles from the default -> (single head towards point) to a double headed arrow <->. We
ax.annotate('Local Max',
            xy =(3.3, 1),
            xytext =(3.5, 1.8),
            arrowprops = dict(arrowstyle = "<->"))
Just keep in mind that you cannot use arrow styles with the shrink and width parameters. It will throw an error if you try. You can technically use facecolor, but it won’t have any effect with most arrow styles. Use color instead.
Let’s take a look at some more examples and customizations.
Arrowstyles Examples
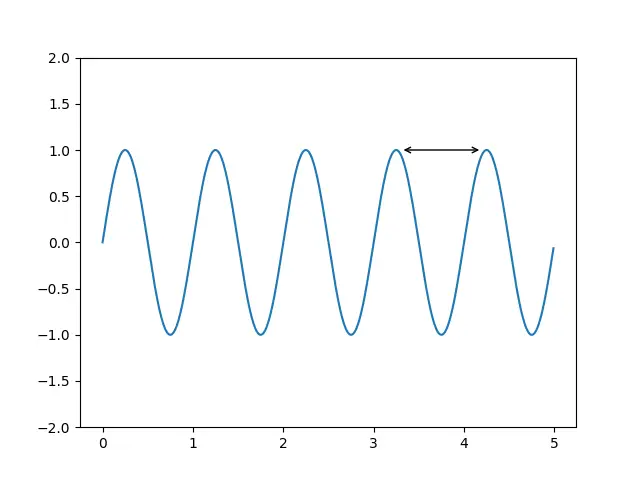
An interesting use of the double headed arrow is to connect two points on the same graph. We can set the text parameter to null, and use its coordinates for the other point.
ax.annotate('',
            xy =(3.3, 1),
            xytext =(4.2, 1),
            arrowprops = dict(arrowstyle = "<->"))
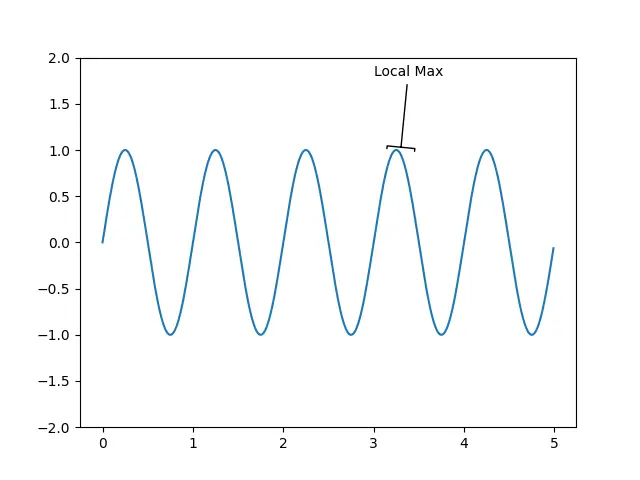
Here we have changed the arrowhead to something resembling a square bracket. This is common type of arrowhead used for annotation of a larger area, not just a single point.
ax.annotate('Local Max',
            xy =(3.3, 1),
            xytext =(3, 1.8),
            arrowprops = dict(arrowstyle = "-["))
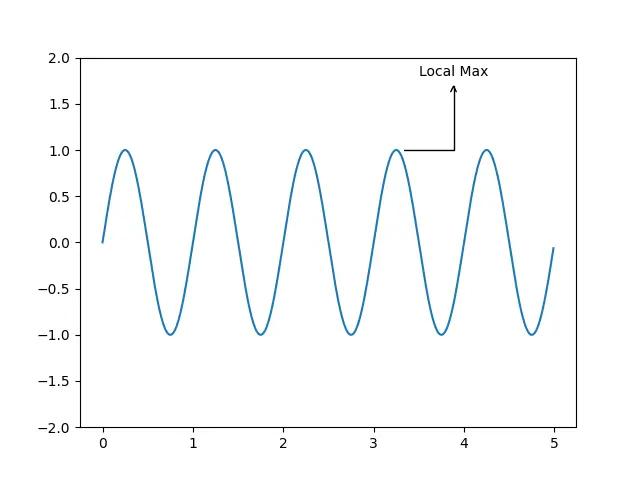
Here we use another special parameter called connectionstyle. This parameter controls the way the “point of interest” is connected to the text. The angle connection style creates a 90 degree angled line as shown below.
ax.annotate('Local Max',
            xy= (3.3, 1),
            xytext= (3.5, 1.8),
            arrowprops= dict(arrowstyle="->",
                              connectionstyle="angle"))
Here is a type of arrowstyle where we can use facecolor. This arrow style creates a proper arrowhead which has some internal area, rather than a simple line. We also have used angle3 as a connection style, which makes a curved arrow.
ax.annotate('Local Max',
            xy= (3.3, 1),
            xytext= (3.5, 1.8),
            arrowprops= dict(facecolor = "red",
                             arrowstyle= "-|>",
                             connectionstyle="angle3"))
Its a bit hard to see the red color in the arrowhead with its default size. You can always customize it and make it bigger though.

Further Reading
You can further customize arrowstyles and arrowprops by passing in extra parameters. There are various hidden attributes which control the angles, head sizes, length, width and more. We talk more about in separate tutorials, so be sure to check them out.
Annotations in Matplotlib are quite a vast topic with many features and classes, many of which we haven’t covered in this tutorial. If you want to learn more about annotation your Matplotlib code, check out the matplotlib documentation.
If there is something you are having difficulty, let us know in the comments section.
This marks the end of the Matplotlib Text Annotation Tutorial. Any suggestions or contributions for CodersLegacy are more than welcome. Questions regarding the tutorial content can be asked in the comments section below.