This tutorial explains how to integrate JFreeChart into JavaFX.
JFreeChart is a Java library used for creating high quality and professional looking graphs and charts of various types. In it’s default form the graphs it produces are limited to how they are presented. The most common options are PNG or JPG images that are created when you run the code.
PNG or JPG images that you have to manually open (from where ever they were saved) aren’t very practical when creating a software application. You obviously want the chart or graph to show up in the software itself when you run the code. This is where the GUI framework JavaFX comes in.
Maven Dependency
Unlike Swing and AWT, JFreeChart’s regular version doesn’t support JavaFX integration. Luckily there is another official version that comes with built in JavaFX support.
Swing and AWT are both outdated by 2020, so JavaFX is the best option moving forward.
The method we used is one of the simplest. Through the use of Maven we were able to add the following dependency just by inserting the following code in the right place. Take our Maven tutorial if it’s your first time.
<dependency>
    <groupId>org.jfree</groupId>
    <artifactId>jfreechart-fx</artifactId>
    <version>1.0.1</version>
</dependency>
As far as we’ve tested, any function that can be used with the regular JFreeChart also works just fine with this FX version. You could also just keep both the regular and FX version of JFreeChart dependencies in your Maven project.
JFreeChart ChartViewer
You don’t actually need more than a dozen lines of code for JavaFX in order to integrate JFreeChart into it. If you learn the below technique you can use the same thing with any chart available in JFreeChart.
The Class that makes this integration possible is called ChartViewer. It can be integrated directly into the JavaFX GUI code.
The below code has three methods in it. The first is the main function, which will launch the JavaFX application. The second method is the function that will create the chart to be displayed on the JavaFX GUI and then return the chart object. The third is the method that contains the JavaFX code will call the second method, using ChartViewer to display the chart.
The explanation of the code for the second method is done in it’s respective article (Histogram tutorial). You just need to pick up the concept that the second method is in charge of handling the dataset and creating a chart to be returned.
import javafx.application.Application;
import javafx.scene.Scene;
import javafx.stage.Stage;
import org.jfree.chart.ChartFactory;
import org.jfree.chart.JFreeChart;
import org.jfree.data.statistics.HistogramDataset;
import org.jfree.chart.fx.ChartViewer;


public class Tutorial extends Application{

    public static void main(String[] args) {
        launch(args);
    }

    public static JFreeChart createChart() {

        double[] values = { 95, 49, 14, 59, 50, 66, 47, 40, 1, 67,
        		            12, 58, 28, 63, 14, 9, 31, 17, 94, 71,
        		            49, 64, 73, 97, 15, 63, 10, 12, 31, 62,
        		            93, 49, 74, 90, 59, 14, 15, 88, 26, 57,
        		            77, 44, 58, 91, 10, 67, 57, 19, 88, 84
                          };


        HistogramDataset dataset = new HistogramDataset();
        dataset.addSeries("key", values, 20);

        JFreeChart histogram = ChartFactory.createHistogram("JFreeChart Histogram",
                               "y values", "x values", dataset);

        return histogram;
    }

    @Override
    public void start(Stage stage) throws Exception {

        ChartViewer viewer = new ChartViewer(createChart());
        stage.setScene(new Scene(viewer));
        stage.setTitle("JFreeChart: Histogram");
        stage.setWidth(600);
        stage.setHeight(400);
        stage.show();
    }
}
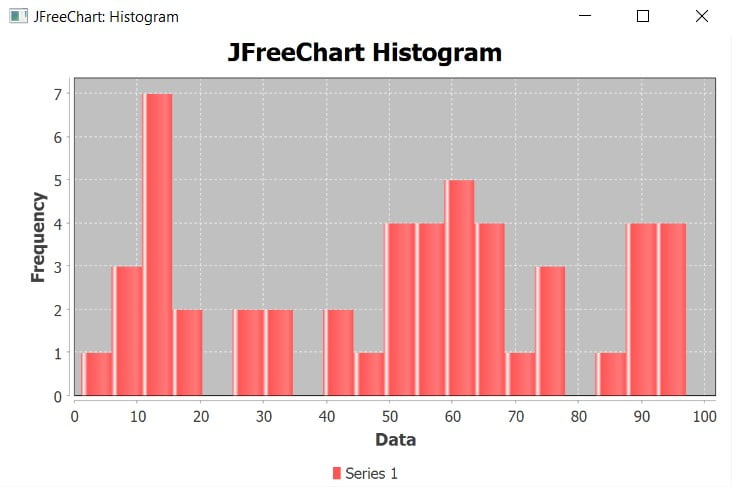
The output of the above code:

If you want to learn more about the GUI library JavaFX (which the 1st and 3rd methods are based on), read up more on our tutorial here. The more JavaFX you know the better. You could create many supporting GUI components for your charts, like interactive buttons and labels if you learn it properly.
This marks the end of the JFreeChart with JavaFX tutorial. Any suggestions or contributions for CodersLegacy are more than welcome. Questions regarding the article content can be asked in the comments section below.
