
This is a tutorial on the Histogram in JFreeChart.
A histogram is a graphical representation that organizes a group of data points into user-specified ranges. Often a histogram will visually look similar to bar chart.
The Histograms excels at taking in a large amount of data and grouping them into certain “ranges” or “bins” to display the frequency of their occurring.
In this tutorial we’ll be explaining how to create Histograms with the Java JFreeChart Library. We’ll be including two different versions here, one with a JavaFX integration and the other with a more standard image output. Benefits of both are described in their respective sections.
JFreeChart Histogram Example
Before attempting to create any chart or histogram in JFreeChart you need to have a dataset available. For this histogram we just randomly generated 50 different numbers that we will now insert to see how the histogram groups them. This dataset is stored in the array values.
We can’t just insert this array into the histogram in it’s current form. We need to create a proper dataset object with several values. Using the HistogramDataset class we create a dataset object and then use the addSeries() method on it which takes three parameters.
The first is the name of the series you are adding, second is the set of values that you want to display, third is the number of bins or groups that you want. A “bin” is another word for a division or group in a histogram. Passing a value of 10 will create 10 divisions into which the data will be sorted according to their values. 20 will create 20 divisions and so on. You can look at the output for a better understanding.
import javafx.application.Application;
import javafx.scene.Scene;
import javafx.stage.Stage;
import org.jfree.chart.ChartFactory;
import org.jfree.chart.ChartUtils;
import org.jfree.chart.JFreeChart;
import org.jfree.data.statistics.HistogramDataset;
import java.io.File;
import java.io.IOException;
public class Tutorial {
public static void main(String[] args) throws IOException {
double[] values = { 95, 49, 14, 59, 50, 66, 47, 40, 1, 67,
12, 58, 28, 63, 14, 9, 31, 17, 94, 71,
49, 64, 73, 97, 15, 63, 10, 12, 31, 62,
93, 49, 74, 90, 59, 14, 15, 88, 26, 57,
77, 44, 58, 91, 10, 67, 57, 19, 88, 84
};
HistogramDataset dataset = new HistogramDataset();
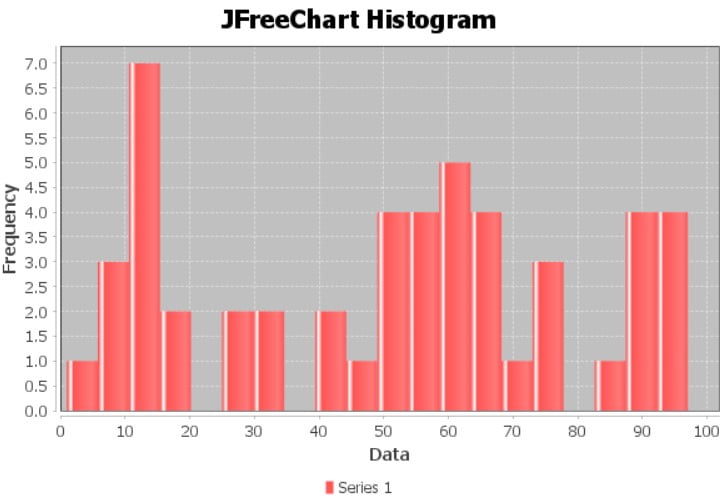
dataset.addSeries("key", values, 20);
JFreeChart histogram = ChartFactory.createHistogram("JFreeChart Histogram",
"Data", "Frequency", dataset);
ChartUtils.saveChartAsPNG(new File("C://Users/CodersLegacy/Desktop/histogram.png"), histogram, 600, 400);
}
}
The array you use must be of type double!
The last two functions are the createHistogram and saveChartAsPNG methods. createHistogram() takes 4 parameters, a title, a label for the X axis, a label for the Y axis and a dateset object. The saveChartAsPNG() takes a file path, the histogram object we created and the width and height respectively to create and save the image at the specified location.
A screenshot of the output after we opened the image file.
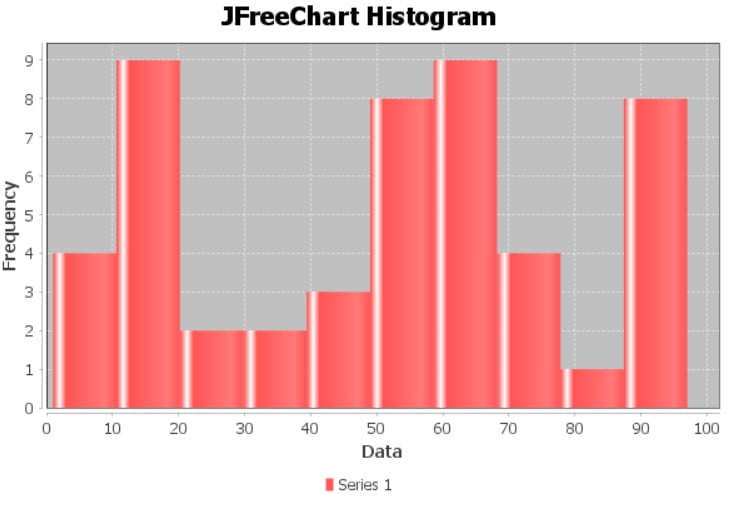
Let’s try changing the number of bins to 10 instead of 20. We now get the following output. Notice that you will only see 10 divisions in the below chart, whereas the above chart has 20 (Don’t expect all divisions to have values in them).
If you’re using an old version of JFreeChart, I highly recommend you upgrade using this guide. Otherwise you should be aware of slight differences between this version (1.5.0) and previous versions. For example ChartUtils was previously ChartUtilities.
JFreeChart Histogram with JavaFX
JavaFX is one of the many GUI libraries in Java. Because it’s the latest and most well used we’re using this to demonstrate how to insert a JFreeChart Histogram into a GUI window instead of an image file.
There are a few pre-requisites required to use this JavaFX version, and as you can see, there are some unique imports included as well. Read up on this installation tutorial (if you don’t already have it setup) which explains the process of bringing in JavaFX support (it’s just a single step using maven).
Most of the code is the same, especially the second method which is the same code from the previous example. The only difference is that instead of using the histogram object in the saveAsPNG method, we return it.
Once it is returned we use the special ChartViewer class to create a chart viewer object using the histogram and then insert this into the JavaFX Scene using setScene.
import javafx.application.Application;
import javafx.scene.Scene;
import javafx.stage.Stage;
import org.jfree.chart.ChartFactory;
import org.jfree.chart.JFreeChart;
import org.jfree.data.statistics.HistogramDataset;
import org.jfree.chart.fx.ChartViewer;


public class Tutorial extends Application{

    public static void main(String[] args) {
        launch(args);
    }

    public static JFreeChart createChart() {

        double[] values = { 95, 49, 14, 59, 50, 66, 47, 40, 1, 67,
        		            12, 58, 28, 63, 14, 9, 31, 17, 94, 71,
        		            49, 64, 73, 97, 15, 63, 10, 12, 31, 62,
        		            93, 49, 74, 90, 59, 14, 15, 88, 26, 57,
        		            77, 44, 58, 91, 10, 67, 57, 19, 88, 84
                          };

        HistogramDataset dataset = new HistogramDataset();
        dataset.addSeries("key", values, 20);

        JFreeChart histogram = ChartFactory.createHistogram("JFreeChart Histogram",
                               "Data", "Frequency, dataset);

        return histogram;
    }

    @Override
    public void start(Stage stage) throws Exception {

        ChartViewer viewer = new ChartViewer(createChart());
        stage.setScene(new Scene(viewer));
        stage.setTitle("JFreeChart: Histogram");
        stage.setWidth(600);
        stage.setHeight(400);
        stage.show();
    }
}
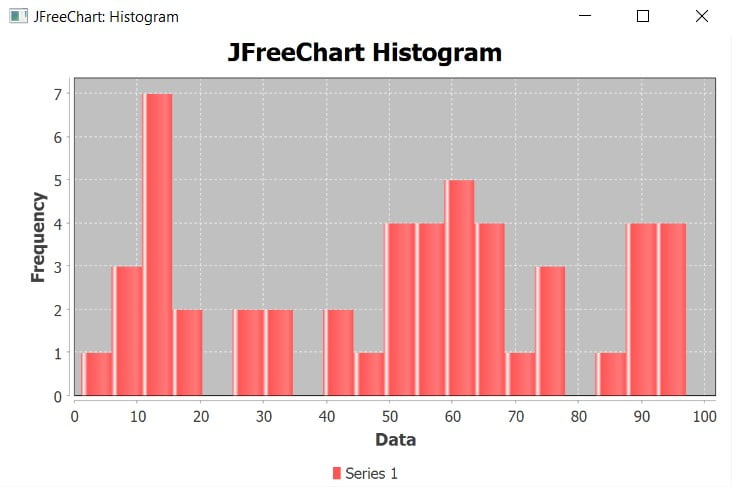
Here is a screenshot of the output. Notice the JavaFX GUI window around the JFreeChart histogram. The obvious benefit is that this chart generates right in front of you at the runtime instead of an image file. And by adding extra features like buttons you can make it more interactive.
This marks the end of the JFreeChart Histogram tutorial. Any suggestions or contributions for CodersLegacy are more than welcome. Questions regarding the article content can be asked in the comments section below.