
Matplotlib provides us with several Classes which allows Matplotlib graphs and plotting features to be integrated inside Tkinter GUI. One of these classes is FigureCanvasTkAgg which is a special canvas upon which Matplotlib Graphs can be plotted, and it can also be inserted into Tkinter GUI as a regular Tkinter widget.
This tutorial will explain how you can setup the FigureCanvasTkAgg, draw a matplotlib graph on it, and insert it into a basic Tkinter window!
Embedding Matplotlib Graphs in Tkinter with FigureCanvasTkAgg
Matplotlib has a special module called backends which contains various submodules for integration with other popular libraries such as Tkinter. The backend library for Tkinter is called backend_tkagg, which holds various Classes which can be used for Matplotlib and Tkinter integration. This is where we will import FigureCanvasTkAgg from.
from matplotlib.backends.backend_tkagg import FigureCanvasTkAgg
Now it’s time to setup our Tkinter application and create the Canvas object.
To create our Tkinter application, we will call the tk.Tk() function which returns a root object. To create our matplotlib figure and axis, we will use plt.subplots(). We will now use the figure and root to create and position the Canvas inside the Tkinter GUI.
from matplotlib.backends.backend_tkagg import FigureCanvasTkAgg
import tkinter as tk
import matplotlib.pyplot as plt

root = tk.Tk()
fig, ax = plt.subplots()

canvas = FigureCanvasTkAgg(fig, root)
The first parameter of the FigureCanvasTkAgg() Class, is the Matplotlib Figure object. The second parameter is the Tkinter application’s root object.
We aren’t done with our Canvas object yet though. To actually make it display correctly on the Window, we need to do two more things.
First we need to call the draw() method. After that we need to call the pack() method with the expand parameter set to True (allows it to resize with the window) and the fill parameter set to tk.BOTH (expand in both x and y directions). We can’t call pack() directly on the canvas though, we first need to call get_tk_widget().
from matplotlib.backends.backend_tkagg import FigureCanvasTkAgg
import tkinter as tk
import matplotlib.pyplot as plt

root = tk.Tk()
fig, ax = plt.subplots()

canvas = FigureCanvasTkAgg(fig, root)
canvas.draw()
canvas.get_tk_widget().pack(fill=tk.BOTH, expand=True)

root.mainloop()
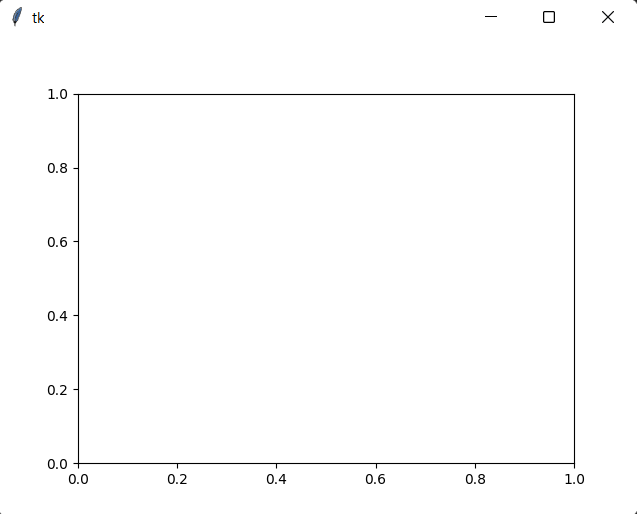
We now have an empty Canvas setup in our Tkinter window! The axis are visible, but there is nothing inside it, as we have not plotted anything.
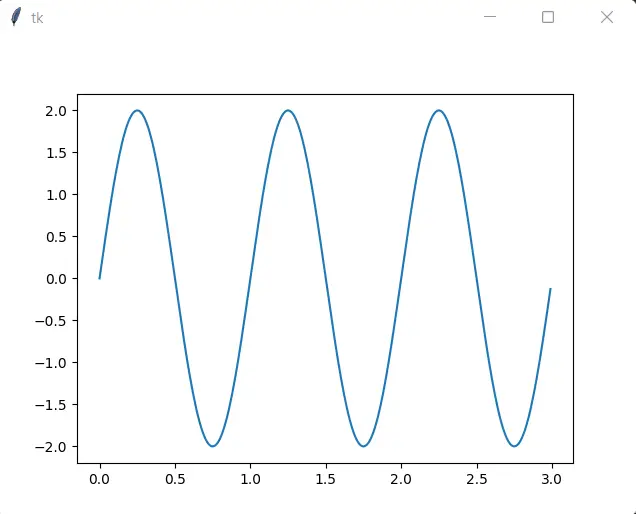
Using Numpy, we will generate some random data (in the form of a sine wave), and plot it to our graph.
import tkinter as tk
import matplotlib.pyplot as plt
import numpy as np
from matplotlib.backends.backend_tkagg import FigureCanvasTkAgg, NavigationToolbar2Tk

root = tk.Tk()
fig, ax = plt.subplots()

t = np.arange(0, 3, .01)
line, = ax.plot(t, 2 * np.sin(2 * np.pi * t))

canvas = FigureCanvasTkAgg(fig, root)
canvas.draw()
canvas.get_tk_widget().pack(fill=tk.BOTH, expand=True)

root.mainloop()
Here is our output.
And that’s all! Good luck with your future Matplotlib and Tkinter collaborations!
Navigation Toolbar
If you are familiar with Matplotlib, you might have noticed the lack of a toolbar in our Tkinter application. This toolbar helps interact with the Matplotlib graph (zoom features, save ability, etc.). If you wish to see how to add this into Tkinter, follow the link to this tutorial.
This marks the end of the FigureCanvasTkAgg with Matplotlib and Tkinter Tutorial. Any suggestions or contributions for CodersLegacy are more than welcome. Questions regarding the tutorial content can be asked in the comments section below.
Example shows plot fills screen. Can you show example where plot can be located on a grid layout with other widgets around it?