
In this tutorial we will show you how to integrate the Matplotlib NavigationToolbar2Tk into our Tkinter application. Our previous tutorial covered the FigureCanvasTkAgg, which is one of the two Classes introduced by Matplotlib for embed graphs inside Tkinter (the other Class is NavigationToolbar2tk).
We shall be continuing off with where we left in the previous tutorial. If you are not familiar with FigureCanvasTkAgg, then follow the link to our tutorial on it. There is no point in adding a Navigation Toolbar unless we have a Canvas.
Displaying NavigationToolbar2Tk to Tkinter
Here is our current code.
import tkinter as tk
import matplotlib.pyplot as plt
import numpy as np
from matplotlib.backends.backend_tkagg import FigureCanvasTkAgg, NavigationToolbar2Tk

root = tk.Tk()
fig, ax = plt.subplots()

t = np.arange(0, 3, .01)
line, = ax.plot(t, 2 * np.sin(2 * np.pi * t))

canvas = FigureCanvasTkAgg(fig, root)
canvas.draw()
canvas.get_tk_widget().pack(fill=tk.BOTH, expand=True)

root.mainloop()
And here is the current state of our GUI application.
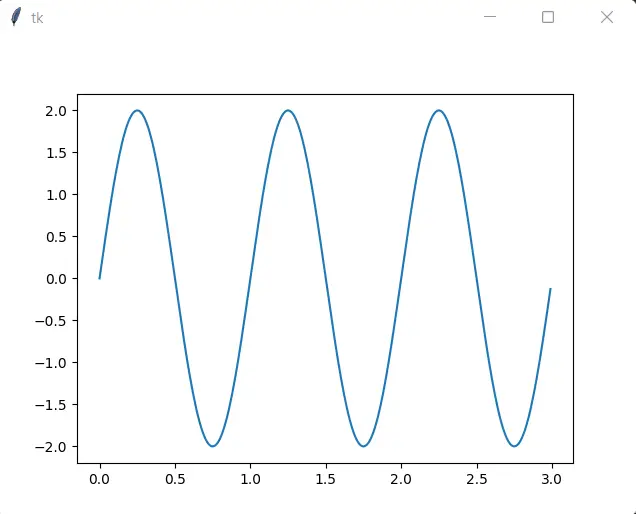
If you are familiar with Matplotlib, you will notice that we are currently missing the Navigation Toolbar which provides us with helpful features to interact with the graph, such as Zoom in, Zoom out, Save Graph, etc.
To enable these features, we must add NavigationToolbar2Tk to our Tkinter GUI. From the same place where we imported FigureCanvasTkAgg, we will also import NavigationToolbar2Tk.
from matplotlib.backends.backend_tkagg import FigureCanvasTkAgg, NavigationToolbar2Tk
We will now create our toolbar object. The first parameter taken by NavigationToolbar2Tk is the Canvas object which the toolbar will attached too. After that is the root parameter, which takes the object return by the tkinter Tk() function (or whichever window your canvas is in).
toolbar = NavigationToolbar2Tk(canvas, root, pack_toolbar=False)
pack_toolbar is a bit of an optional setting recommended by Matplotlib. It makes layout management of the toolbar easier in Tkinter.
toolbar.update()
toolbar.pack(side=tk.BOTTOM, fill=tk.X)
After this we need to call the update() method on the toolbar object (for initialization purposes). Finally we pack it into our Tkinter GUI by calling pack(), and passing the appropriate parameters. The first parameter places it at the bottom of the window, and the second allows it to expand horizontally (as the window grows).
Here is our full code.
import matplotlib.pyplot as plt
import numpy as np
from matplotlib.backends.backend_tkagg import FigureCanvasTkAgg, NavigationToolbar2Tk

root = tk.Tk()
fig, ax = plt.subplots()

t = np.arange(0, 3, .01)
line, = ax.plot(t, 2 * np.sin(2 * np.pi * t))

canvas = FigureCanvasTkAgg(fig, root)
canvas.draw()
canvas.get_tk_widget().pack(fill=tk.BOTH, expand=True)

toolbar = NavigationToolbar2Tk(canvas, root, pack_toolbar=False)
toolbar.update()
toolbar.pack(side=tk.BOTTOM, fill=tk.X)

root.mainloop()
And here is our final output.
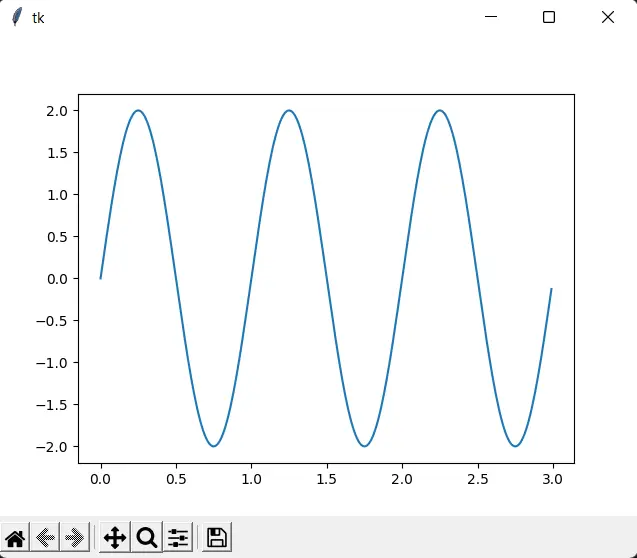
We now have our Navigation Toolbar added! Try clicking on the Magnifying glass for zooming in and out. Or the crosshairs for navigating your graph (useful when graph is larger than the visible area). The last icon in the toolbar is used for saving your graph as an image.
This marks the end of the How to use Matplotlib navigationtoolbar2tk Tutorial. Any suggestions or contributions for CodersLegacy are more than welcome. Questions regarding the tutorial content can be asked in the comments section below.