
This is an article explaining the use of Area Chart in JFreeChart.
The purpose of an Area Chart is to graphically represent the change in quantitative data over time. Area Charts are actually based of line charts, but the area between the line and the axis is colored (usually) to show a strong emphasis.
With the JFreeChart library, we’ll be showing you how to create an Area Chart in Java. We’ll be sharing two different variations. The first is the regular way with the Area Chart produced as an image file. Whereas the second method involves integrating it within the JavaFX GUI library.
JFreeChart Area Chart Example
If you don’t know anything about JavaFX or don’t have any of the pre-requisites required to be using JavaFX in JFreeChart, read this tutorial guide here.
The process of creating an area chart is almost identical to that of the JFreeChart Line Chart. The only differences are in the names of a few functions where “LineChart” is replaced with “AreaChart”.
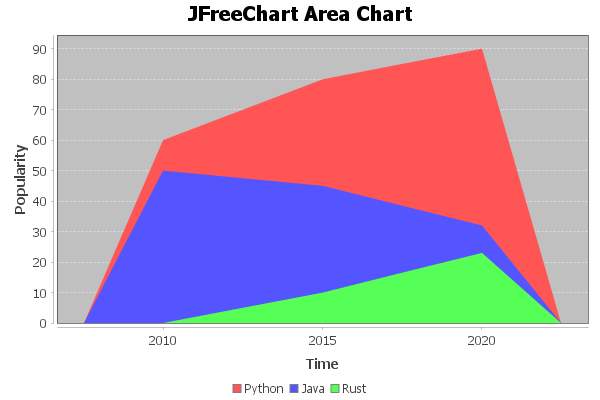
Like we always do with JFreeChart, we’re going to first create a Dataset object and begin adding the data to it using the addValue method. It takes three parameters, a value, a series name and a label for the X-Axis. Refer to the output image below for reference.
The last two functions are for creating the AreaChart and the image file for the chart respectively. The parameters are fairly obvious as to what they represent so no need to explain that.
import org.jfree.chart.ChartFactory;
import org.jfree.chart.ChartUtils;
import org.jfree.chart.JFreeChart;
import org.jfree.chart.plot.PlotOrientation;
import org.jfree.data.category.DefaultCategoryDataset;
import java.io.File;
import java.io.IOException;


public class Tutorial {
    public static void main(String[] args) throws IOException {

        DefaultCategoryDataset dataset = new DefaultCategoryDataset();

        dataset.addValue(60, "Python", "2010");
        dataset.addValue(80, "Python", "2015");
        dataset.addValue(90, "Python", "2020");

        dataset.addValue(50, "Java", "2010");
        dataset.addValue(45, "Java", "2015");
        dataset.addValue(32, "Java", "2020");

        dataset.addValue(0,  "Rust", "2010");
        dataset.addValue(10, "Rust", "2015");
        dataset.addValue(23, "Rust", "2020");


    	JFreeChart areaChart = ChartFactory.createAreaChart(
    	        "JFreeChart Area Chart", // Chart title
    	        "Time", // X-Axis Label
    	        "Popularity", // Y-Axis Label
    	        dataset // Dataset for the Chart
    	        );

        ChartUtils.saveChartAsPNG(new File("C://Users/CodersLegacy/Desktop/JFreeChart_Area_Chart.png"), areaChart, 600, 400);
    }
}
The output of the above example:
AreaChart with JavaFX
Having only an image file being produced as the output can be a little inconvenient. For a better solution we’re going to be using the JavaFX GUI Library to “host” the chart we create in a proper GUI window. Read this setup tutorial first if you don’t know how to bring in support for JavaFX into JFreeChart.
The Class that makes all this possible in ChartViewer. It takes the Area Chart object we created and converts it into a suitable format for JavaFX to display.
import javafx.application.Application;
import javafx.scene.Scene;
import javafx.stage.Stage;
import org.jfree.chart.ChartFactory;
import org.jfree.chart.JFreeChart;
import org.jfree.data.category.DefaultCategoryDataset;
import org.jfree.chart.fx.ChartViewer;


public class Tutorial extends Application{
    public static void main(String[] args) {
        launch(args);
    }

    public static JFreeChart createChart() {

        DefaultCategoryDataset dataset = new DefaultCategoryDataset();

        dataset.addValue(60, "Python", "2010");
        dataset.addValue(80, "Python", "2015");
        dataset.addValue(90, "Python", "2020");

        dataset.addValue(50, "Java", "2010");
        dataset.addValue(45, "Java", "2015");
        dataset.addValue(32, "Java", "2020");

        dataset.addValue(0,  "Rust", "2010");
        dataset.addValue(10, "Rust", "2015");
        dataset.addValue(23, "Rust", "2020");


    	JFreeChart areaChart = ChartFactory.createAreaChart(
    	        "JFreeChart Area Chart", // Chart title
    	        "Time", // X-Axis Label
    	        "Popularity", // Y-Axis Label
    	        dataset // Dataset for the Chart
    	        );

    	return areaChart;
    }

    @Override
    public void start(Stage stage) throws Exception {

        ChartViewer viewer = new ChartViewer(createChart());
        stage.setScene(new Scene(viewer));
        stage.setTitle("JFreeChart: AreaChart");
        stage.setWidth(600);
        stage.setHeight(400);
        stage.show();
    }
}
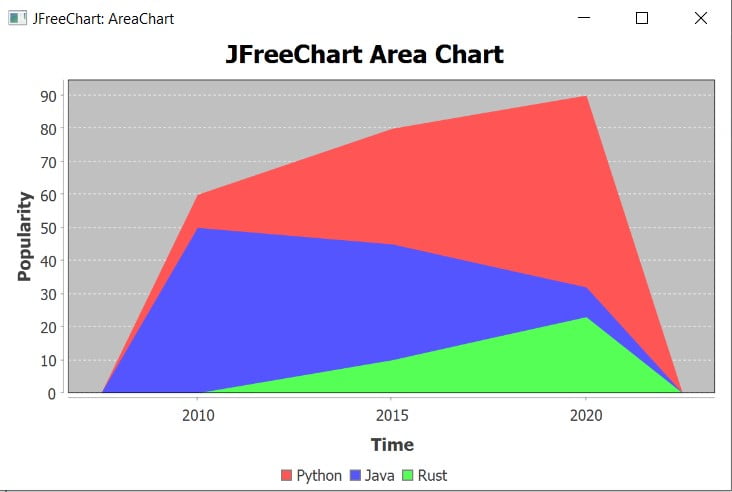
The output of the above code. You can see the GUI window of JavaFX around the JFreeChart Area Chart!
This marks the end of the JFreeChart Area Chart tutorial. Any suggestions or contributions for CodersLegacy are more than welcome. Questions regarding the article content are more than welcome.