
This tutorial covers the JFreeChart Line Chart.
A line chart or line graph is a type of chart which displays data as a series of data points called ‘markers’, connected by straight line segments. The most common use of line charts are to show the trend (such as increasing values) of the data over time.
We’ll be using two different examples here, first using the regular inbuilt functions and the second being combined together with JavaFX.
JFreeChart Line Chart Example
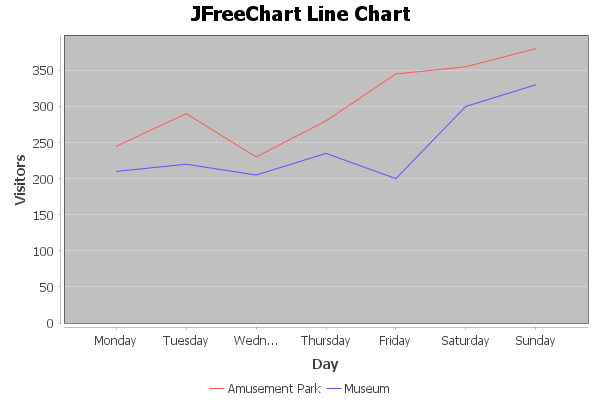
We’re going to be creating two series, one for an Amusement park and one for a museum. We’re going to be tracking the number of visitors to each location on each day of the week. The goal is have this data plotted and compare the two.
As is common with all JFreeChart charts, we first create the dataset and begin adding in data for each series. Data is added using the addValue() function which takes three parameters, the value, the series name and the label of the X-axis.
Once the dataset object is complete, you pass it into the createLineChart() function along with a few other parameters. This returns a JFreeChart LineChart object which we can then output as an image using the saveChartAsPNG() function.
import javafx.application.Application;
import javafx.scene.Scene;
import javafx.stage.Stage;
import org.jfree.chart.ChartFactory;
import org.jfree.chart.ChartUtils;
import org.jfree.chart.JFreeChart;
import org.jfree.chart.plot.PlotOrientation;
import org.jfree.data.category.DefaultCategoryDataset;
import java.io.File;
import java.io.IOException;

public class Tutorial {

    public static void main(String[] args) throws IOException {

    	String series1 = "Amusement Park";
    	String series2 = "Museum";

    	DefaultCategoryDataset dataset = new DefaultCategoryDataset();

        dataset.addValue(245, series1, "Monday");
        dataset.addValue(290, series1, "Tuesday");
        dataset.addValue(230, series1, "Wednesday");
        dataset.addValue(280, series1, "Thursday");
        dataset.addValue(345, series1, "Friday");
        dataset.addValue(355, series1, "Saturday");
        dataset.addValue(380, series1, "Sunday");

        dataset.addValue(210, series2, "Monday");
        dataset.addValue(220, series2, "Tuesday");
        dataset.addValue(205,  series2, "Wednesday");
        dataset.addValue(235, series2, "Thursday");
        dataset.addValue(200, series2, "Friday");
        dataset.addValue(300, series2, "Saturday");
        dataset.addValue(330, series2, "Sunday");

    	JFreeChart lineChart = ChartFactory.createLineChart(
    	        "JFreeChart Line Chart", // Chart title
    	        "Day", // X-Axis Label
    	        "Visitors", // Y-Axis Label
    	        dataset // Dataset for the Chart
    	        );

        ChartUtils.saveChartAsPNG(new File("C://Users/CodersLegacy/Desktop/linechart.png"), lineChart, 600, 400);
    }
}
The output of the above code:
JFreeChart LineChart with JavaFX
There are a few conditions that have to be met before you can begin using JavaFX with JFreeChart. If you haven’t already set it up, read this guide here to understand how.
The Class that makes all this possible in ChartViewer. It takes the lineChart object we created and converts it into a suitable format for JavaFX to display.
import javafx.application.Application;
import javafx.scene.Scene;
import javafx.stage.Stage;
import org.jfree.chart.ChartFactory;
import org.jfree.chart.ChartUtils;
import org.jfree.chart.JFreeChart;
import org.jfree.chart.plot.PlotOrientation;
import org.jfree.data.category.DefaultCategoryDataset;
import org.jfree.chart.fx.ChartViewer;


public class Tutorial extends Application{
    public static void main(String[] args) {
        launch(args);
    }

    public static JFreeChart createChart() {

    	String series1 = "Amusement Park";
    	String series2 = "Museum";

    	DefaultCategoryDataset dataset = new DefaultCategoryDataset();

        dataset.addValue(245, series1, "Monday");
        dataset.addValue(290, series1, "Tuesday");
        dataset.addValue(230, series1, "Wednesday");
        dataset.addValue(280, series1, "Thursday");
        dataset.addValue(345, series1, "Friday");
        dataset.addValue(355, series1, "Saturday");
        dataset.addValue(380, series1, "Sunday");

        dataset.addValue(210, series2, "Monday");
        dataset.addValue(220, series2, "Tuesday");
        dataset.addValue(205,  series2, "Wednesday");
        dataset.addValue(235, series2, "Thursday");
        dataset.addValue(200, series2, "Friday");
        dataset.addValue(300, series2, "Saturday");
        dataset.addValue(330, series2, "Sunday");

    	JFreeChart lineChart = ChartFactory.createLineChart(
    	        "JFreeChart Line Chart", // Chart title
    	        "Day",                   // X-Axis Label
    	        "Visitors",              // Y-Axis Label
    	        dataset                  // Dataset for the Chart
    	        );

    	return lineChart;
    }

    @Override
    public void start(Stage stage) throws Exception {

        ChartViewer viewer = new ChartViewer(createChart());
        stage.setScene(new Scene(viewer));
        stage.setTitle("JFreeChart: LineChart");
        stage.setWidth(600);
        stage.setHeight(400);
        stage.show();
    }
}
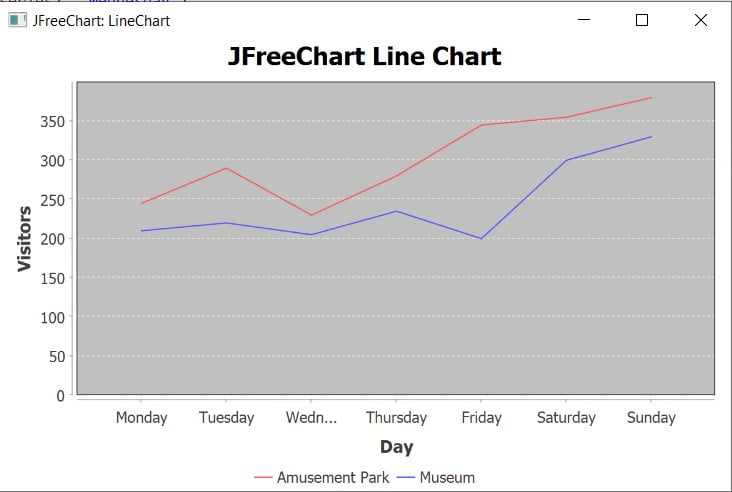
The GUI output of the above code. Notice the JavaFX window around the JFreeChart Line chart.
Also check out the similar JFreeChart AreaChart.
This marks the end of the JFreeChart Line Chart tutorial. Any suggestions for contributions for CodersLegacy are more than welcome. Questions regarding the article content can be asked in the comments section below.