
Normally when you create a Matplotlib Chart/Graph it is displayed in a small window. But what happens when you want to create multiple plots in matplotlib? Creating multiple windows with one graph each is not the solution as it would greatly clutter the screen.
Instead, what we can do is plot multiple graphs into a single window. In this tutorial we will discuss various ways of doing so, and learn how to manage multiple graphs at once too.
Creating Multiple Plots with subplots()
Normally we can use the subplots() function to create a single window with a single graph. This is the most common way of creating graphs in matplotlib. However, we can also use this function for creating multiple graphs simply by adjusting the parameters.
Let’s take a look at a normal example first.
import matplotlib.pyplot as plt
import numpy as np

x = np.arange(-6, 6, 0.1)
y = np.cos(x)

fig, ax = plt.subplots()
ax.plot(x, y)
plt.show()

Here we created a basic figure with just one single graph. Now let’s try to add another.
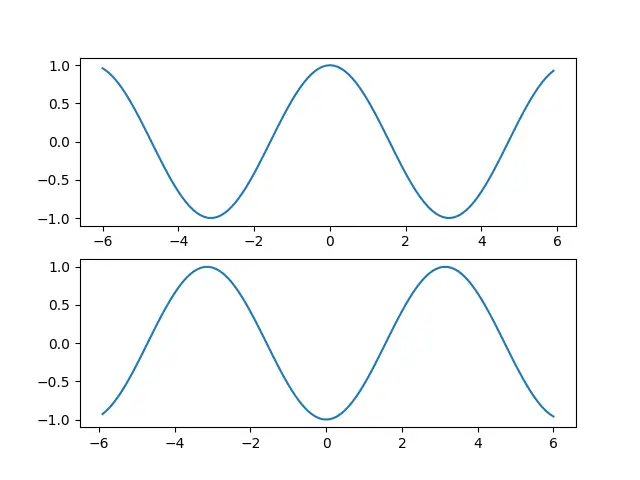
Instead of leaving the parameters for subplots() empty, pass in two new parameters. The first argument is the number of rows, and the second is the number of columns. Passing in 2 and 1 respectively will give us two graphs vertically stacked on each other.
import matplotlib.pyplot as plt
import numpy as np

x = np.arange(-6, 6, 0.1)
y = np.cos(x)

fig, ax = plt.subplots(2, 1)
ax[0].plot(x, y)
ax[1].plot(-x, -y)
plt.show()
One significant difference here, is that there are now multiple axes objects. There is only one figure object, because are plotting within a single window. But since there are two graphs, there are two axes objects.
Even more Plots in Matplotlib!
Lets do another example with even more plots.
This time we have created 4 graphs in a 2 by 2 grid. Notice that the axes objects are now stored in a 2×2 matrix as well. In other words, the dimensions of the axes object matches that of the subplots.
import matplotlib.pyplot as plt
import numpy as np

x1 = np.arange(-6, 6, 0.1)
y1 = np.cos(x1)

x2 = np.arange(-12, 12, 0.1)
y2 = np.sin(x2)

fig, ax = plt.subplots(2, 2)
ax[0, 0].plot(x1, y1)
ax[0, 1].plot(-x1, -y1)
ax[1, 0].plot(x2, y2)
ax[1, 1].plot(x2, -y2)

plt.show()

Changing colors for individual plots
Having all the plots share the same color can be rather annoying. Using the color parameter, you can customize the colors used for each plot.
import matplotlib.pyplot as plt
import numpy as np

x1 = np.arange(-6, 6, 0.1)
y1 = np.cos(x1)

x2 = np.arange(-12, 12, 0.1)
y2 = np.sin(x2)

fig, ax = plt.subplots(2, 2)
ax[0, 0].plot(x1, y1, color = "green")
ax[0, 1].plot(-x1, -y1, color = "red")
ax[1, 0].plot(x2, y2, color = "yellow")
ax[1, 1].plot(x2, -y2)

plt.show()

Alternative Method – Tuple Unpacking
There is another way of managing the multiple plots using the concept of tuple unpacking. The syntax is a bit different, but the purpose is the same.
from turtle import color
import matplotlib.pyplot as plt
import numpy as np

x = np.arange(-6, 6, 0.1)
y = np.cos(x)

fig, (ax1, ax2) = plt.subplots(2, 1)
ax1.plot(x, y, color = "green")
ax2.plot(-x, -y)
plt.show()

Here is another example with tuple unpacking, showing how to unpack the axes objects when dealing with two-dimensional grids. The syntax, as you can see is a bit tricky which is why we don’t use this that often.
import matplotlib.pyplot as plt
import numpy as np

x1 = np.arange(-6, 6, 0.1)
y1 = np.cos(x1)

x2 = np.arange(-12, 12, 0.1)
y2 = np.sin(x2)

fig, ((ax1, ax2), (ax3, ax4)) = plt.subplots(2, 2)
ax1.plot(x1, y1, color = "green")
ax2.plot(-x1, -y1, color = "red")
ax3.plot(x2, y2, color = "yellow")
ax4.plot(x2, -y2)

plt.show()
This marks the end of the How to create multiple Plots in Python Matplotlib Tutorial. Any suggestions or contributions for CodersLegacy are more than welcome. Questions regarding the tutorial content can be asked in the comments section below.
I would like to write a comment (question) on the following article and YT video:
https://coderslegacy.com/python/matplotlib-add-subplots-to-figure/
I don’t know how to comment on this article and how to contact someone (email) at all.
regards Linus