
This article covers the Pygal library in Python.
Pygal is a Python Library designed with the purpose of creating high resolution and interactive graphs. Pygal specializes in the creation of SVG’s (Scalable Vector Graphics). Not only are these very scalable and high quality, you can easily integrate them with other frameworks and applications.
Another similar graphing library is Matplotlib, which is focused more towards the logic (statistics) behind the charts rather than the look.
Not only does Pygal create good looking graphs, it also allows you to interact with them in a way no other library allows you to. You can interact with every component, from the graph to the “legend” (the key). After each section, a short video will be uploaded to show you these interactions.
Before we continue you should know that Pygal is only officially supported on Python 3.6, 3.7, 3.8, 3.9 and pypy. However, the documentation seems rather outdated and Pygal seems to work just fine with newer version like 3.7.4 (The version used in this article).We will be using Python 3.5 for the rest of this article that we setup through the use of a Virtual-Environment.
Setting up Pygal
Pygal can be a bit complicated to set up. Installing the library is the first step. If you use pip, simply use the pip install pygal command.
However, there may be times, when trying to use a function or feature, you will end up with a missing module error. This is because Pygal relies on certain libraries to carry out certain functions.
These are four additional libraries (dependencies) that you may require. Install them if you end up running into any errors or problems down the line.
pip install lxmlpip install cairosvgpip install tinycsspip install cssselect
Pygal Graphs
One of Pygal’s many strengths is the low amount of code required to create such complex and feature rich graphs. On top of all that, you can easily switch between Pie charts, bar charts and line graphs easily by simply changing a single line.
You’ll understand better once you have seen the code and their respective outputs below. The code doesn’t need much explaining, what little their is to explain is done in the comments.
Pie Charts
import pygal

data = [
  ["Python", 20],
  ["Java", 18],
  ["C++", 15],
  ["JavaScript", 9],
  ["C#", 5],
  ["C", 12],
  ["PHP", 3],
  ["Objective-C", 7],
]

# Creates a Pygal chart
pie_chart = pygal.Pie()

# Adds a title (heading)
pie_chart.title = "Popular Programming Languages"

# Add the data to be displayed
for label, data_points in data:
    pie_chart.add(label, data_points)

# Render the chart
pie_chart.render_to_file("PieChart.svg")
The following code produced a file in the same location as the Python script. I used my web browser (Chrome) to open it. A short video of my interaction with it is shown below.
You can also use render_in_browser() as an alternative. It renders your graph/chart directly onto your default browser (like Chrome). It basically skips out on the middle step where you have to open the SVG file. Also, this isn’t restricted to just Pie charts. It works on other graphs and charts too.
Bar Charts
Luckily there are many types of Bar charts, so we’ll get to show off several different types.
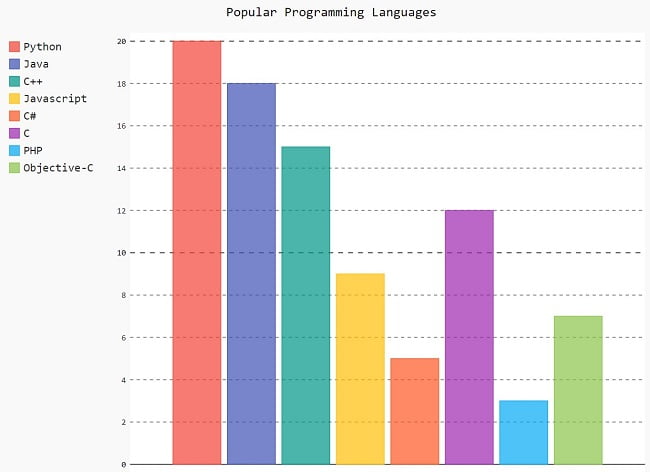
For the first example, a simple Bar chart, we’ll re-use the same data-set we used earlier. Such a chart is useful for comparing many sets of data of together.
import pygal

data = [
  ["Python", 20],
  ["Java", 18],
  ["C++", 15],
  ["JavaScript", 9],
  ["C#", 5],
  ["C", 12],
  ["PHP", 3],
  ["Objective-C", 7],
]

# Make a Pygal chart
bar_chart = pygal.Bar()

# add a title
bar_chart.title = "Popular Programming Languages"

# add the data
for label, data_points in data:
    bar_chart.add(label, data_points)

# Render the chart
bar_chart.render_to_file("BarChart.svg")
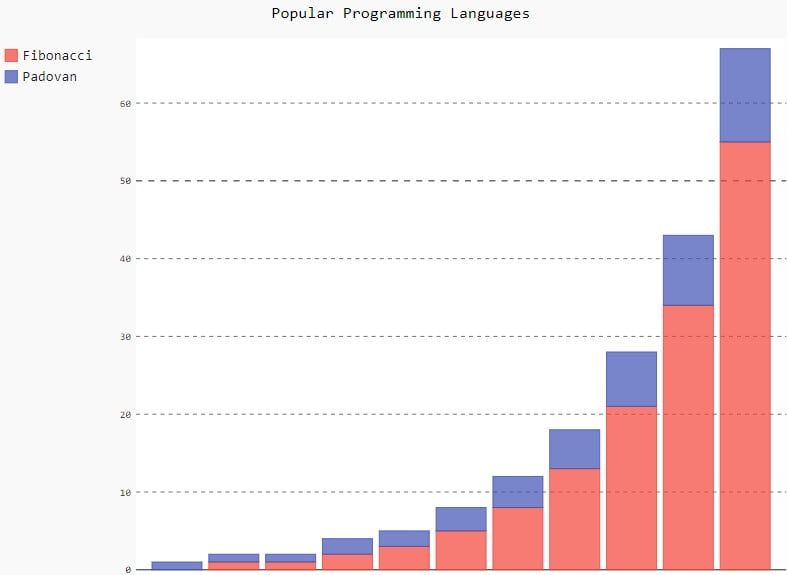
Next is the Stacked Bar chart. This is used to measure how 2 or more sets of data change over a period of different values/time.
We’ve taken a slightly different approach to adding the data this time due to the nature of the Stacked-Bar chart.
import pygal

# Make a Pygal chart
stackedbar_chart = pygal.StackedBar()

# add a title
stackedbar_chart.title = "Popular Programming Languages"

# adding the data
stackedbar_chart.add('Fibonacci', [0, 1, 1, 2, 3, 5, 8, 13, 21, 34, 55])
stackedbar_chart.add('Padovan', [1, 1, 1, 2, 2, 3, 4, 5, 7, 9, 12])

# Render the chart
stackedbar_chart.render_to_file("StackedBarChart.svg")
We decided to go with a picture instead of a video. You can interact with it in the same way as we showed earlier.
You can use an horizontal versions of the above graphs by calling HorizontalBar() and HorizontalStackedBar() respectively.
Line Chart
import pygal

# Make a Pygal chart
line_chart = pygal.Line()

# add a title
line_chart.title = "Random Data"

# add the data
line_chart.x_labels = map(str, range(2000, 2011))
line_chart.add("DataSet1", [None, None, 0, 2, 5, 5, 6, 4, 7, 8, 8])
line_chart.add("DataSet2", [0, 3, 4, 8, 9, 6, 3, 1, 0 ,None, None])
line_chart.add("DataSet3", [2, 3, 5, 4, 3, 2, 3, 2, 4, 5, 3])

# Render the chart
line_chart.render_to_file("LineChart.svg")
The output:
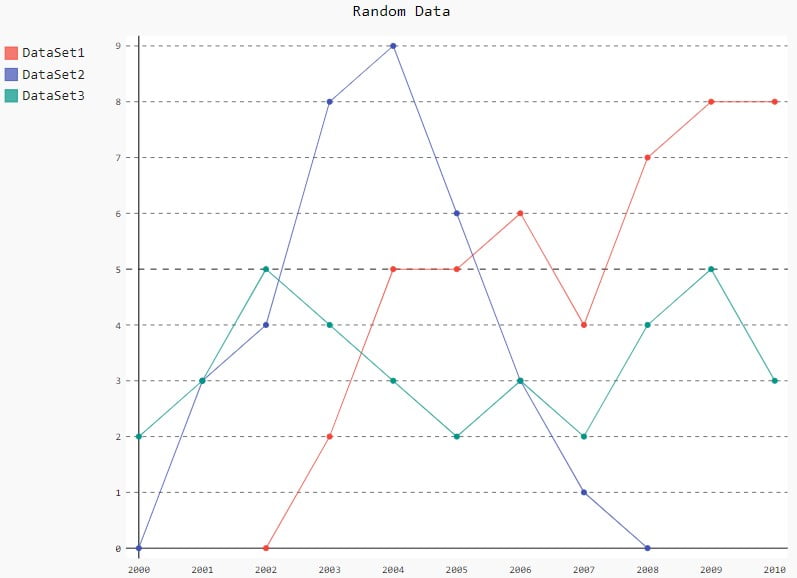
There is a difference between using None and 0. 0 is an actual number that will appear on the graph, None however will not., indicating “No data” rather than “zero data”.
PNG Graphs
Bonus: There is another function called render_to_png(). As the name implies, it’s used to create png (image) versions of the graphs you create in Pygal. If you wish to use this function, you need to install the last three libraries (pygal dependencies) we mentioned in the start of the article.
However, remember that you cannot interact with PNG files the same way as we did with SVG files in the examples above.
This marks the end of the Python Pygal Tutorial. Any suggestions or contributions for CodersLegacy are more than welcome. Questions regarding the article content can be asked in the comments section below.