
In this Matplotlib tutorial we will explore how to represent our data using a BoxPlot. Another common name for the BoxPlot you may recognize is “Box and Whisker Plot”.
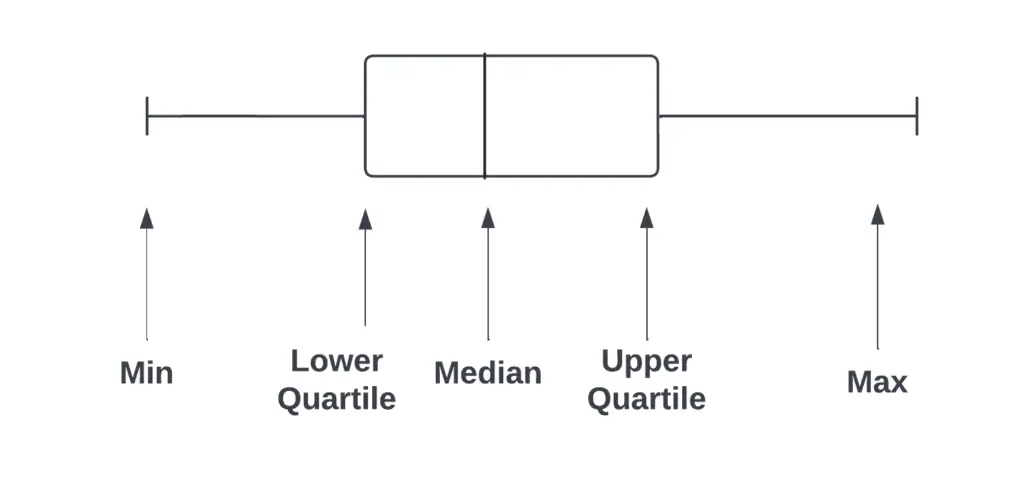
A BoxPlot is used to represent a dataset in the form of Lines. Each line represents an important piece of information. A typical BoxPlot contains the following lines:
lower quartile,median,upper quartile,inter-quartile range(IQR),min=lower quartile - 1.5*IQR,max=upper quartile + 1.5*IQR
Here is a nice diagram for a standard Box Plot. (The Interquartile range is the upper quartile – lower quartile)
Matplotlib BoxPlot (Box and Whisker)
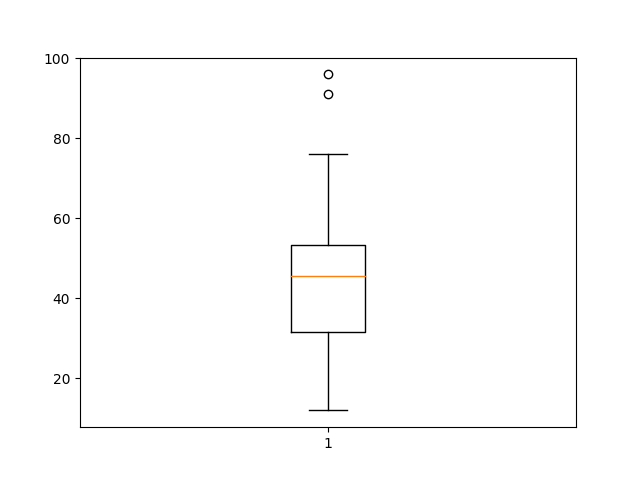
Creating a BoxPlot is really straightforward, using a single list as a dataset, and a single function with a single parameter to plot the data.
import matplotlib.pyplot as plt

fig, ax = plt.subplots()

dataset = [21,44,32,76,54,32,46,22,12,51,
           48,43,28,45,49,71,53,30,96,91]

plt.boxplot(dataset)
plt.show()
And here is our output. The orange line in the middle represents the median. Those two little circles at the top of the plot represent outliers. These lie outside the min and max ranges of our data.
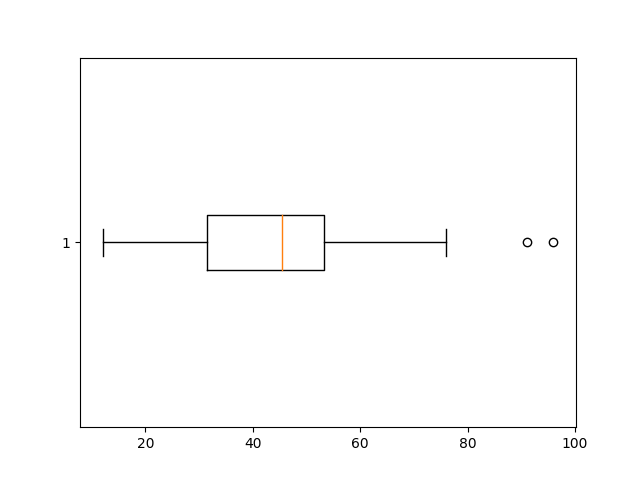
As we showed you earlier, you can also plot Box Plots horizontally. All we need to do is make the vert parameter False in the boxplot() function. (Default is True)
plt.boxplot(dataset, vert=False)
plt.show()
Box Plot Example#2
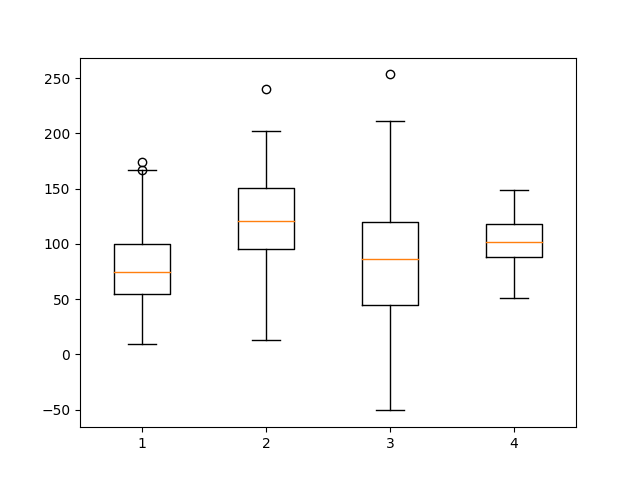
You can also plot more than one BoxPlot on the same graph. The only difference here is that we now pass our multiple datasets in the form of a list into the boxplot() function.
import matplotlib.pyplot as plt
import numpy as np

fig, ax = plt.subplots()

dataset1 = np.random.normal(80, 30, 100)
dataset2 = np.random.normal(120, 40, 100)
dataset3 = np.random.normal(90, 50, 100)
dataset4 = np.random.normal(100, 20, 100)

plt.boxplot([dataset1, dataset2, dataset3, dataset4])
plt.show()
And here is our output:
Customizing your Box Plot
There are several ways in which we can customize our BoxPlot by displaying extra information, or hiding some current information (such as outliers)
Showing the Mean
import matplotlib.pyplot as plt
fig, ax = plt.subplots()
dataset = [21,44,32,76,54,32,46,22,12,51,
48,43,28,45,49,71,53,30,96,91]
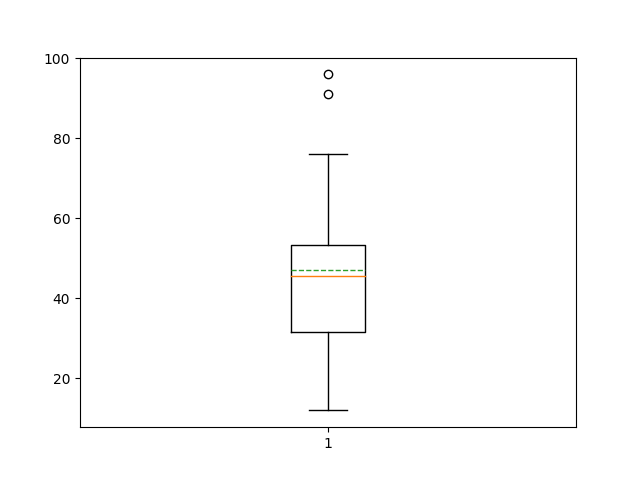
ax.boxplot(dataset, showmeans=True, meanline=True)
plt.show()
The green dotted line near the center represents the mean.
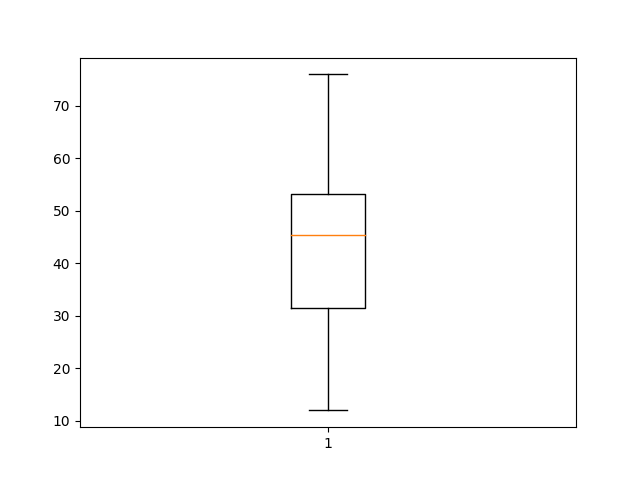
Hide Outliers
This technique is useful if the outliers are not important for your plot.
ax.boxplot(dataset, showfliers=False)
plt.show()
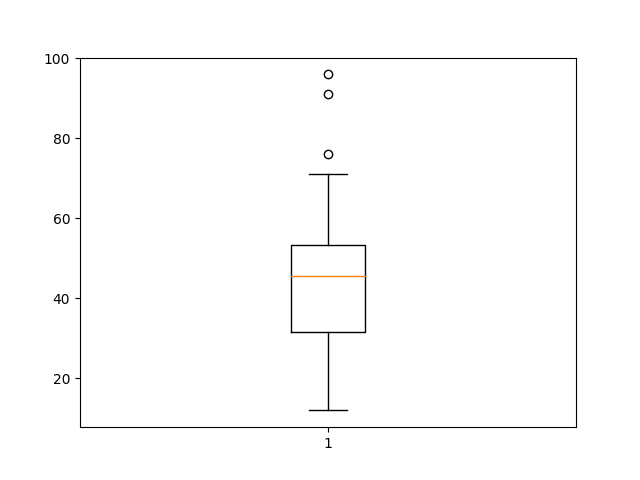
Shorten Whiskers
By default the min and max values are decided by multiplying the interquartile range by a certain factor (usually 1.5) and subtracting this from lower quartile and adding it into the upper quartile.
ax.boxplot(dataset, whis=1)
plt.show()
We can change this factor by modifying the whis parameter. If we want to be stricter with the outliers, we can shorten the whisker length to 1.
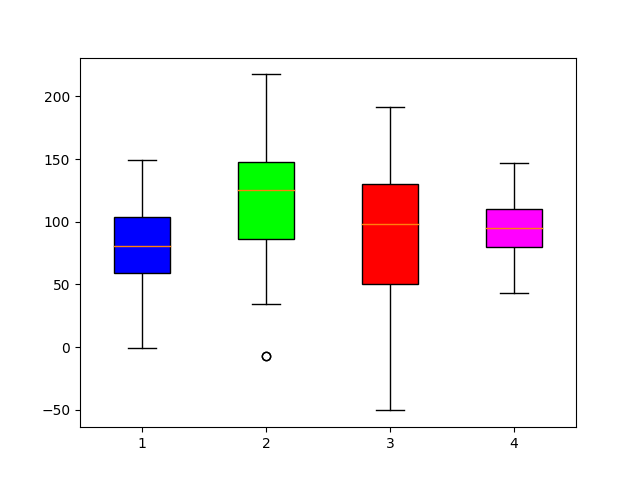
Change Color
Make sure to keep patch_artist=True, otherwise the code will throw an error while attempting to change the Color.
import matplotlib.pyplot as plt
import numpy as np

fig, ax = plt.subplots()

dataset1 = np.random.normal(80, 30, 100)
dataset2 = np.random.normal(120, 40, 100)
dataset3 = np.random.normal(90, 50, 100)
dataset4 = np.random.normal(100, 20, 100)

colors = ['#0000FF', '#00FF00','#FF0000', '#FF00FF']
box = plt.boxplot([dataset1, dataset2, dataset3, dataset4], patch_artist=True)

for patch, color in zip(box['boxes'], colors):
    patch.set_facecolor(color)

plt.show()
Interested in our 50+ collection of matplotlib tutorials? Follow the link..
This marks the end of the Matplotlib BoxPlot Tutorial. Any suggestions or contributions for CodersLegacy are more than welcome. Questions regarding the tutorial content can be asked in the comments section below.