
In this tutorial we will be exploring the use of the FuncAnimation Class in Matplotlib. FuncAnimation is one of the two classes in Matplotlib’s animation module which can be used to animate graphs and plots. This tutorial will explore how to create simple animations, and then further customize them using the FuncAnimation class.
Matplotlib Animation with FuncAnimation
The first thing we will do is discuss the FuncAnimation Class and its parameters. There are four main parameters that you will be using quite often, shown in the code below.
anim = FuncAnimation(fig, update, frames = 20, interval=100)
fig:The matplotlib figure which the animation will be playing on.func:A function that will be called in every frame. Used to update/modify the graph in some manner. (e.g: Adding a new point in a line graph or a new bar in a bar graph)frames:The number of times the function infuncwill be called. This parameter takes an integer value. If you do not specify any value, this will be infinite.interval:The delay between “frames” or “function calls”. Represented in milliseconds.
There are more parameters that we will discuss later in the tutorial. For now we will work with these 4.
Animating a Bar Graph
Throughout this tutorial, we will be focusing on animating a Bar graph. We will modify our parameters and customize the animation in various ways.
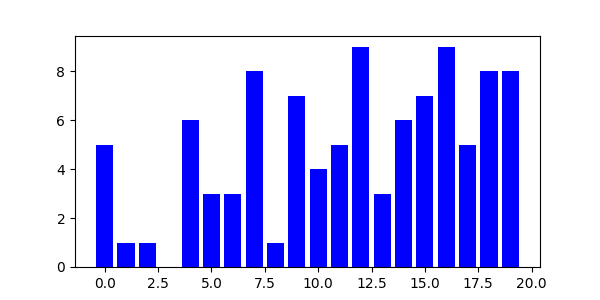
Lets start off by plotting a simple Bar chart without any animation. There isn’t much code involved here. We used range(20) to generate 20 values from 0 to 19 for the x-axis, and used a numpy random function to generate 20 values ranging from 0 to 10. We then pass these into plt.bar() to plot our barchart.
import matplotlib.pyplot as plt
import numpy as np

fig, ax = plt.subplots(figsize=(6, 3))
x = range(20)
y = np.random.randint(0, 10, 20)

bars = plt.bar(x, y, color="blue")
plt.show()
Now lets add some animation. Instead of all the data appearing at once, we will have it show up one by one with a small interval. After modifying our code to include the FuncAnimation class, we get the following:
import matplotlib.pyplot as plt
from matplotlib.animation import FuncAnimation
import numpy as np

fig, ax = plt.subplots(figsize=(6, 3))
x = range(20)
y = [0] * 20

bars = ax.bar(x, y, color="blue")
ax.axis([0, 20, 0, 10])  # x-axis from 0 to 20
                         # y-axis from 0 to 10

def update(frame):
    y[frame] = np.random.randint(0, 10)
    bars[frame].set_height(y[frame])

anim = FuncAnimation(fig, update, frames=20, interval=100)
plt.show()
Our code looks quite different because of the nature of the Bar chart in Matplotlib. In order to update it, we have to access each bar individually and set its height using the set_height() function. The bar() function returns an iterable which contains all the bar objects. We can either access this as a list as we did above, or iterate over it in a for loop.
You might wonder where the frame parameter in the update function came from. This is actually automatically passed by FuncAnimation as the current frame number (starting from zero). So for the 10th frame, the integer 10 will be passed into update().
Here is a GIF of the above code during its execution:
Now lets try to customize this animation using the various options (parameters) in FuncAnimation.
Customizing Matplotlib FuncAnimation
One slight problem with our current animation is that it constantly loops around. This happens rather quickly, so we don’t get to see the final result for too long before it loops back again. There are two ways we can handle this problem.
The first method is to just disable the animation looping by changing the repeat parameters value to False.
anim = FuncAnimation(fig, update, frames = 20, interval=100, repeat = False)
plt.show()
The second method is to introduce a short delay before the animation repeats itself using the repeat_delay parameter.
anim = FuncAnimation(fig, update, frames = 20,
                     interval = 100, repeat_delay = 3000)
plt.show()
We can also modify the frames amount depending on our data, and how long we want our animation to be. For example, in our code from earlier we can increase the number of frames to 50 to create 50 bars in our animation sequence. (Just remember to adjust the other code accordingly too, such as extending the x-axis to 50 values)
bars = ax.bar(x, y, color="blue")
ax.axis([0, 50, 0, 10])  # x-axis from 0 to 50
                         # y-axis from 0 to 10

def update(frame):
    y[frame] = np.random.randint(0, 10)
    bars[frame].set_height(y[frame])

anim = FuncAnimation(fig, update, frames=50, interval=100)
plt.show()
Another cool thing you can do is pass in any iterable or generator to the frames parameter. Such as a list of integers or the range function as shown below.
anim = FuncAnimation(fig, update, frames = range(20), interval = 100)
plt.show()
Did you know that you can also save animations in Matplotlib to your device as gifs or videos? To learn more about this feature, check out our tutorial on saving animations in matplotlib.
This marks the end of the Matplotlib FuncAnimation in Python Tutorial. Any suggestions or contributions for CodersLegacy are more than welcome. Questions regarding the tutorial content can be asked in the comments section below.