
In this Matplotlib tutorial, we will be demonstrating how to use the Pick Event. The Pick Event is one of the many events in Matplotlib that trigger once a certain action has been performed. These events can be connected to a function that we design, so that whenever the event occurs, the function is called along with it.
So when does the Pick Event trigger? Whenever you click on a “point” such as a point in a scatter plot, or one of the two points in a plotted line, the pick event occurs. Lets explore how we can make use of this.
How to use the Pick Event in Matplotlib
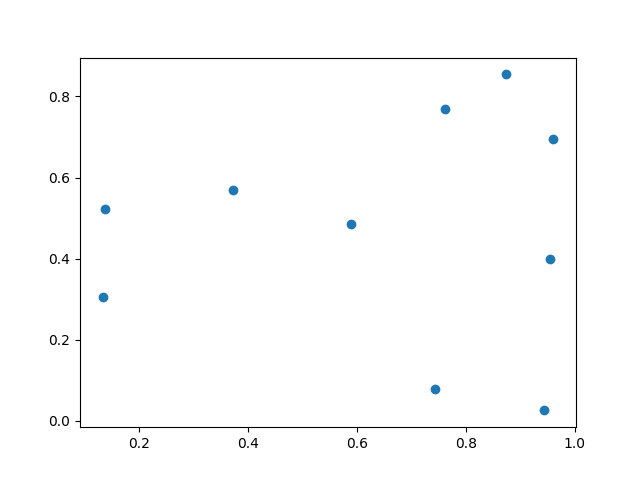
First we need to create our Matplotlib Figure and plot a simple scatter plot. We have plotted 10 different points in our code below, using some random data generated by numpy.
import matplotlib.pyplot as plt
import numpy as np

fig, ax = plt.subplots()

for i in range(10):
    ax.scatter(np.random.random(), np.random.random(),
               picker=True, pickradius=5, color="blue")
plt.show()
The main point of focus here, is in this scatter() function. By default, the picker option is set to False (likely for performance reasons) which disables the “pick_event” from being called whenever the point/artist is clicked.
for i in range(10):
   ax.scatter(np.random.random(), np.random.random(),
               picker=True, pickradius=5, color="blue")
The pickradius allows you to select a point and trigger the pick event even if your mouse click was outside the bounds of the point/artist object. Setting a radius of “5” allows mouse clicks within 5 pixels away from the object to trigger pick events.
Don’t use a very high value though, otherwise it might overlap with other nearby points. This is just a feature for enabling good user experience. Likewise, a very low value (e.g: 0) might make it hard for the user to select the point if it is very small.
Now that we understand how “pick_event” works, let us create the function for it, and connect it to our Matplotlib figure using the mpl_connect() function. The first parameter in this function is the name of the event, and the second is the name of the function that we want called alongside the pick_event.
import matplotlib.pyplot as plt
import numpy as np

def onpick(event):
    print("A point has been selected")

fig, ax = plt.subplots()
fig.canvas.mpl_connect('pick_event', onpick)

for i in range(10):
    ax.scatter(np.random.random(), np.random.random(),
               picker=True, pickradius=0, color="blue")
plt.show()
Here is our current output. Try running the code yourself and observing the output printed to the console.
Modifying Artists in Matplotlib
Once you learn how to detect plotted points with the Pick Event, you need to learn how to actually interact with that “point”. For example, if you click on a point in the scatter plot, you may want some visual indication that you have selected it.
One of the easiest ways to do this is to change the color of the selected point. Lets explore how to do this in the following example.
First we need to import the Artist Class from Matplotlib.
from matplotlib.artist import Artist
The main addition to our code is inside this function.
selectedPoint = None

def onpick(event):
    global selectedPoint
    if selectedPoint != None:
        props = { 'color' : "blue" }
        Artist.update(selectedPoint, props)

    props = { 'color' : "red" }
    Artist.update(event.artist, props)
    selectedPoint = event.artist
    plt.draw()
Basically, what we created a global variable called selectedPoint that stores the currently selected point. Its initial value is None, because no point is selected initially.
The Artist Class has an update() function that takes an artist, and a set of props. We can change the color by passing a key-value pair with the required values. What our code above does, is whenever we click on a point, it will pass in the color props for the color red to that artist object. (Which can be acquired using the artist attribute).
If there is already a currently selected point, it will change its color back to blue, before updating the value of selectedPoint with the new artist object.
So here is our full code.
import matplotlib.pyplot as plt
from matplotlib.artist import Artist
import numpy as np

selectedPoint = None

def onpick(event):
    global selectedPoint
    if selectedPoint != None:
        props = { 'color' : "blue" }
        Artist.update(selectedPoint, props)

    props = { 'color' : "red" }
    Artist.update(event.artist, props)
    selectedPoint = event.artist
    plt.draw()

fig, ax = plt.subplots()
fig.canvas.mpl_connect('pick_event', onpick)

for i in range(10):
    ax.scatter(np.random.random(), np.random.random(),
               picker=True, pickradius=5, color="blue")
plt.show()
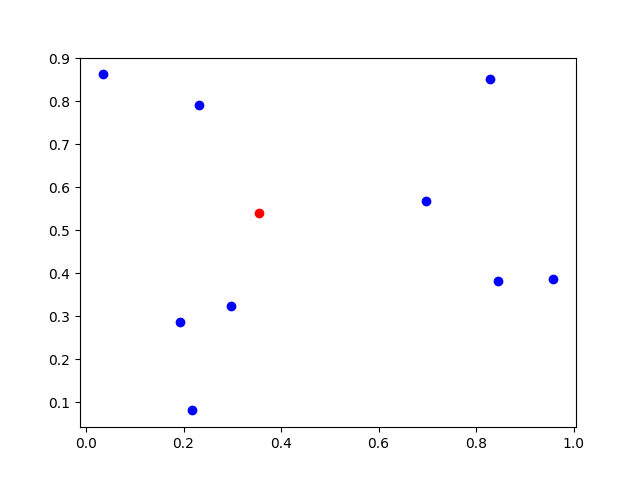
And here is our output. (You can see that we have selected a point on our graph)
Plotting values individually vs All-at-once
One easy mistake to make here, is that you might plot all of the points at once. The problem with this, is that all of the points will be treated as a single artist.
Now in some cases this might be the behavior that you want, so here is an example where all the values were plotted in a single call, rather than individually plotted. Try running the code yourself to see it in action.
import matplotlib.pyplot as plt
from matplotlib.artist import Artist
import numpy as np

def onpick(event):
    props = { 'color' : "red" }
    Artist.update(event.artist, props)
    plt.draw()

fig, ax = plt.subplots()
x = np.random.random(10)
y = np.random.random(10)

fig.canvas.mpl_connect('pick_event', onpick)

ax.scatter(x, y, picker=True, pickradius=5)
plt.show()
You will notice that all of our points get selected. This is expected. You will find this behavior useful when plotting clumps of different data (like 2-3 different groups of data, each consisting of multiple points).
This marks the end of the Matplotlib Pick Event Tutorial. Any suggestions or contributions for CodersLegacy are more than welcome. Questions regarding the article content can be asked in the comments section below.