As you might already know, Matplotlib allows for the creation of multiple plots on a single window. Normally, each of these subplots has their own x-axis and y-axis, because they often have significantly varying data, hence there is no need to share any of them.
However, sometimes we may have multiple plots which have similar data to each other. Such as two graphs for housing prices in two different cities. While their y-axis’s may differ significantly, they might have identical x-axis’s (which could be something like the size of the house in square feet).
In such scenarios, it makes sense for us to create a single shared x-axis instead of two separate ones. Let’s explore how to do this.
Creating a Shared x-axis between Subplots
Creating a shared axis is actually alot easier than it looks. There is only a single change that we need to make to a normal figure with two (or more) plots.
There are actually multiple ways of creating axes objects and figures in matplotlib, so the method for sharing the x-axis can vary. We will discuss two such scenarios in today’s tutorial.
In Scenario# 1, we create the figure and axes object using plt.subplots(). To share the x-axis, all you need to do is pass in the extra parameter sharex = True.
import matplotlib.pyplot as plt
import numpy as np

x = np.arange(-6, 6, 0.1)

y1 = np.sin(x)
y2 = np.cos(x)

fig, ax = plt.subplots(2, 1, sharex = True)
ax[0].plot(x, y1)
ax[1].plot(x, y2)

plt.show()
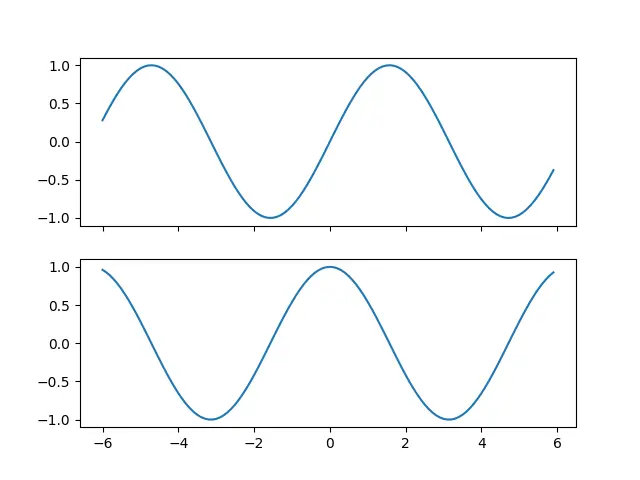
This will produce the following output:

As you can see, the Tick labels are missing from the first plot, which is often (but not always) a sign that the axis have become shared.
Although the labels may be present in both, the number of ticks in both plots will remain the same if the x-axis is shared.
If you used individual plt.subplot() functions instead of plt.subplots() then you can use the sharex parameter as shown below.
fig=plt.figure()
ax1 = plt.subplot(211)
ax2 = plt.subplot(212, sharex = ax1)
This causes ax2 to share the x-axis with ax1.
Sharing x-axis after plotting
Scenario# 2, we have already created and plotted the axes objects and the figure. Previously we made the axis shared before plotting. This example shows you how to make the axis shared after the plotting is done.
import matplotlib.pyplot as plt
import numpy as np

x = np.arange(-6, 6, 0.1)

y1 = np.sin(x)
y2 = np.cos(x)

fig=plt.figure()
ax1 = plt.subplot(211)
ax2 = plt.subplot(212)

ax1.plot(x, y1)
ax2.plot(x, y2)

ax1.get_shared_x_axes().join(ax1, ax2)
# ax1.set_xticklabels([])

plt.show()
This marks the end of the Matplotlib, How to share x-axis between Subplots Tutorial. Any suggestions or contributions for CodersLegacy are more than welcome. Questions regarding the tutorial content can be asked in the comments section below.
