In this Article we’ll be exploring the use of the Python Matplotlib Scatter plot.
What is a Scatter Plot?
Python Matplotlib Scatter plots are used to plot data points on a horizontal and a vertical axis in the attempt to show how much one variable is affected by another. Best used on large spreads of data to look for co-relations or group points.
Scatter plot Example
Creating a simple Scatter plot is very straightforward. Create two lists containing co-ordinates, one for the x-axis, and the other for the y-axis. Proceed to pass both these into the scatter() function, which creates the graph. Calling the show() will then display the graph on screen.
from matplotlib import pyplot as plt

# x-axis values
x = [5, 1, 3, 4, 6]

# Y-axis values
y = [6, 3, 5, 1, 4]

# Function to plot scatter
plt.scatter(x, y)

# function to show the plot
plt.show()

Displaying Multiple Scatter plots
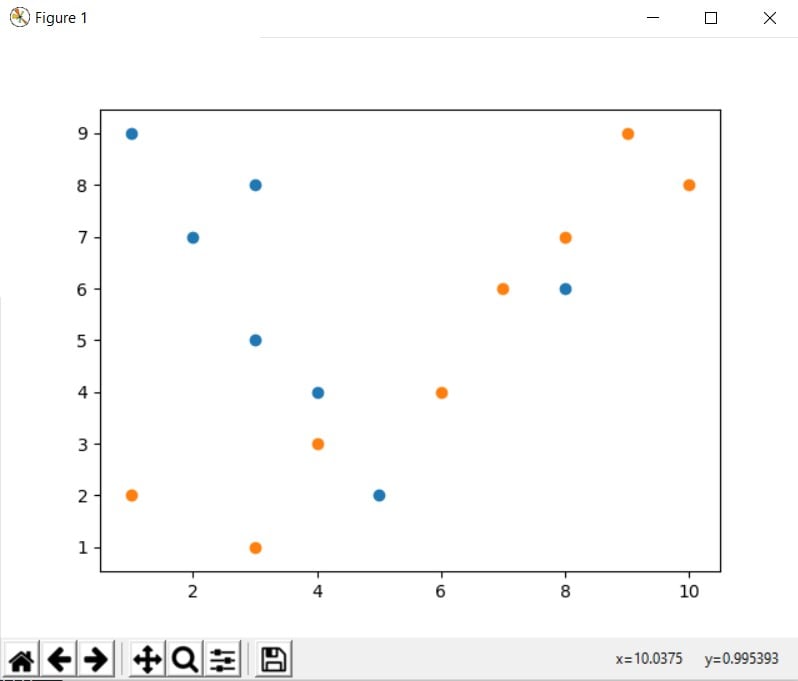
If you want to display multiple scatter plots on the same graph, simply call another scatter() function with the appropriate data set. Be mindful of the X-axis you keep.
Python matplotlib will by default assign different colors to both scatter plots, but you can customize your own colors as well. See the bottom section for this.
from matplotlib import pyplot as plt

# x-axis values
x = [3, 5, 8, 4, 2,3,1]
x2 = [1, 3, 4, 6, 8, 9, 7, 10]

# Y-axis values
y = [5, 2, 6, 4, 7,8,9]
y2 = [2, 1, 3, 4, 7, 9, 6, 8]

# Function to plot scatter
plt.scatter(x, y)
plt.scatter(x2, y2)

# function to show the plot
plt.show()

Interested in creating Scatter Plots in 3D? Follow this tutorial link to find out how!
Customization of Scatter plots
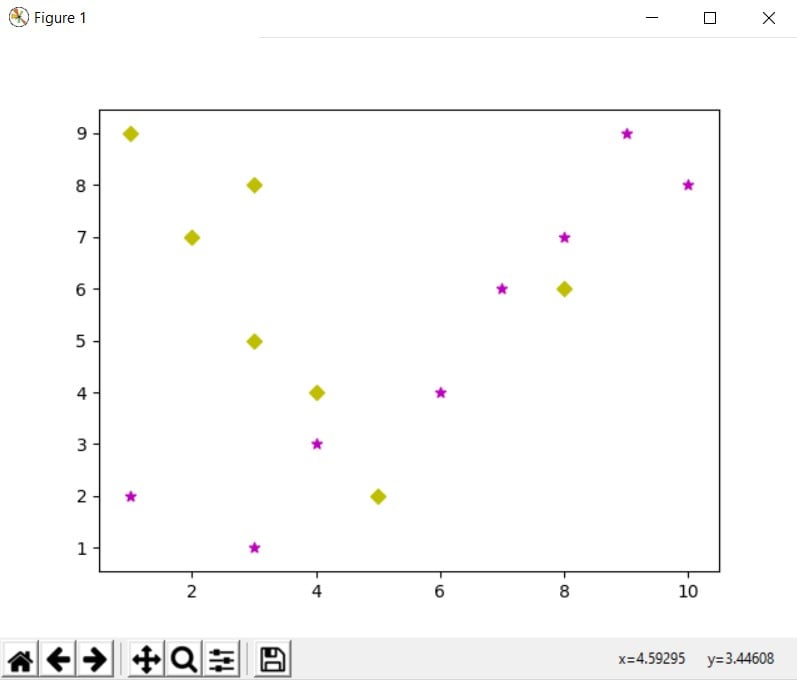
Scatter plots have two additional variables that be passed into the scatter() function to further customize it. The first is the c parameter, which takes as input a color code. See the table below for a full list of color codes.
The second is the marker parameter. By default the marker is a circle, but you can customize it into Diamonds or triangles if you wish. All you have to do is assign to it an appropriate character code. See below for a full list.
from matplotlib import pyplot as plt

# x-axis values
x = [3, 5, 8, 4, 2,3,1]
x2 = [1, 3, 4, 6, 8, 9, 7, 10]

# Y-axis values
y = [5, 2, 6, 4, 7,8,9]
y2 = [2, 1, 3, 4, 7, 9, 6, 8]

# Function to plot scatter
plt.scatter(x, y, c = 'y', marker = 'D')
plt.scatter(x2, y2 c = 'm', marker = '*')

# function to show the plot
plt.show()

| Code | Color |
|---|---|
'b' | blue |
‘g' | green |
'r' | red |
'c' | cyan |
'm' | magenta |
'y' | yellow |
'k' | black |
'w' | white |
| Code | Description |
|---|---|
'.' | point marker |
',' | pixel marker |
'o' | circle marker |
'v' | triangle_down marker |
'^' | triangle_up marker |
'<' | triangle_left marker |
'>' | triangle_right marker |
'1' | tri_down marker |
'2' | tri_up marker |
'3' | tri_left marker |
'4' | tri_right marker |
's' | square marker |
'p' | pentagon marker |
'*' | star marker |
'h' | hexagon1 marker |
'H' | hexagon2 marker |
'+' | plus marker |
'x' | x marker |
'D' | diamond marker |
'd' | thin_diamond marker |
'|' | vline marker |
'_' | hline marker |
This marks the end of our Python Matplotlib Scatter plot Article. Let us know in the comments section if you have any questions or suggestions. Use this link to head back to the main Matplotlib page.
