
In this tutorial we will explore how to create a 3D Scatter Plot in Python using the Matplotlib Plotting Library. But what exactly is a Scatter plot?
A scatter plot (i.e. Scatter graph or Scatter Chart) is a plot which displays a collection of points, plotted as Cartesian coordinates. The “points” represent the values of two or more variables. Scatter plots with two variables, whose values are plotted along the X and Y axis are known as 2D Scatter plots. Those plots with three variables, with values plotted along the X, Y and Z axis are known as 3D Scatter plots.
The purpose of a scatter plot is to show the co-relation between the variables.
Plotting a Scatter Plot in Matplotlib
Let’s take a look at a simple example where we will plot a single 3D Scatter Plot.
We will be using the numpy library to generate some random numbers for us to use. The randint() function is able generate numbers from 0 to 100. The size parameter defines how many numbers are generated (default is one).
import numpy as np
import matplotlib.pyplot as plt
from mpl_toolkits import mplot3d

fig = plt.figure()
ax = plt.axes(projection="3d")

# Creating dataset
z = np.random.randint(0, 100, size =(50))
x = np.random.randint(0, 80,  size =(50))
y = np.random.randint(0, 60,  size =(50))

ax.scatter3D(x, y, z, color = 'red')
plt.show()
After passing the x, y and z values into the scatter3D() function, we get the following plot:

You can use the mouse cursor to manipulate this image and view it from different angles. Run the code for yourself and see the magic!
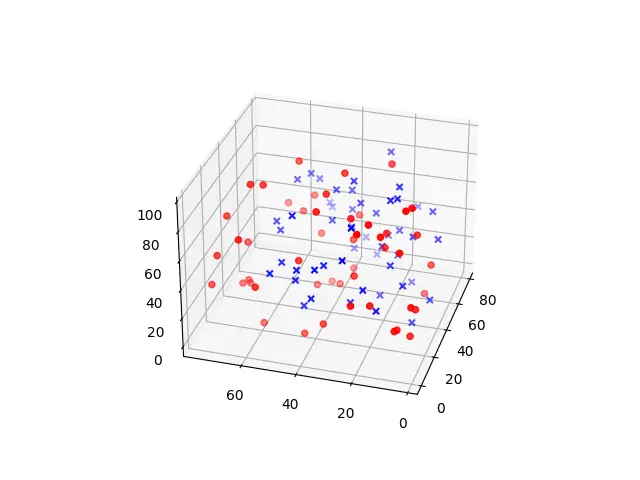
Plotting Multiple Scatter Plots
We are not limited to just once Scatter Plot per graph. If we have more than one variable, we can plot them all on the same graph, simply by calling the scatter() or scatter3D() functions again with the values of the new variable.
import numpy as np
import matplotlib.pyplot as plt
from mpl_toolkits import mplot3d

fig = plt.figure()
ax = plt.axes(projection="3d")

# Creating dataset
x = np.random.randint(0, 60,  size =(50))
y = np.random.randint(0, 80,  size =(50))
z = np.random.randint(0, 100, size =(50))
ax.scatter(x, y, z, color = 'red', marker = 'o')

# Creating dataset-2
x = np.random.randint(0, 80,  size =(50))
y = np.random.randint(0, 60,  size =(50))
z = np.random.randint(0, 90,  size =(50))
ax.scatter(x, y, z, color = 'blue', marker = 'x')

plt.show()
We have used different colors to differentiate the plots. To make it even more distinct we gave them different markers as well.
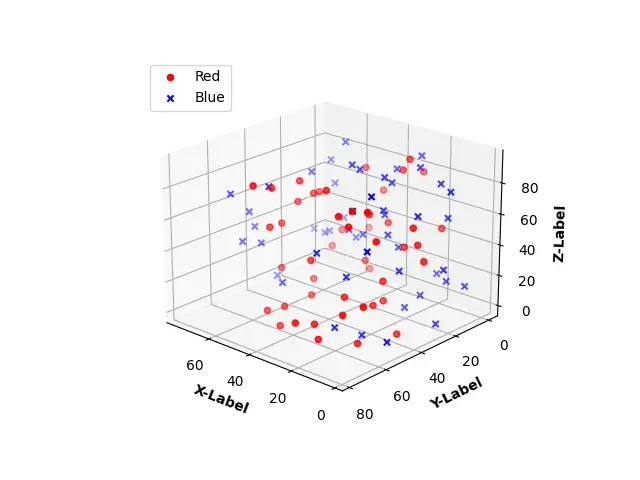
Adding Legends and Labels
As we begin to add more and more scatter plots on a single graph, things can get a little confusing. Furthermore, since we have 3 axis, leaving them unlabeled can be a little confusing, especially if we rotate the graph around.
To add a legend, we need to ensure each Scatter plot has a label. This can be done by passing the label parameter into the scatter() or scatter3D() functions. You can control the position of the legend by passing the appropriate string into the ax.legend() function.
To add labels to the axis, you need to use the set_xlabel(), set_ylabel() and set_zlabel() functions.
import numpy as np
import matplotlib.pyplot as plt
from mpl_toolkits import mplot3d

fig = plt.figure()
ax = plt.axes(projection="3d")

# Creating dataset
x = np.random.randint(0, 60,  size =(50))
y = np.random.randint(0, 80,  size =(50))
z = np.random.randint(0, 100, size =(50))
ax.scatter(x, y, z, color = 'red', marker = 'o', label = "Red")

# Creating dataset-2
x = np.random.randint(0, 80,  size =(50))
y = np.random.randint(0, 60,  size =(50))
z = np.random.randint(0, 90,  size =(50))
ax.scatter(x, y, z, color = 'blue', marker = 'x', label = "Blue")

ax.set_xlabel('X-Label', fontweight ='bold')
ax.set_ylabel('Y-Label', fontweight ='bold')
ax.set_zlabel('Z-Label', fontweight ='bold')
ax.legend(loc='upper left')

plt.show()
This marks the end of the 3D Scatter Plot in Python using Matplotlib Tutorial. Any suggestions or contributions for CodersLegacy are more than welcome. Questions regarding the tutorial content can be asked in the comments section below.