
Matplotlib is a great library for visualizing data using a variety of different graphs, along with supporting features such as Annotations and moving Animations. In order to use these amazing graphs from Matplotlib in other places (e.g. a research paper or assignment) we need a way of “saving” these graphs in the form of a file (e.g: PNG images).
And that is what this tutorial is about! Let’s get started.
Converting Graphs to PNG Images in Matplotlib
Saving a graph as an PNG image in Matplotlib is very simple. By using the plt.savefig() function, and passing in our desired filename, the PNG image will be created.
plt.savefig("myPNG.png")There are just two things to keep in mind. First, that you need to clearly mention the “.png” extension in the file name. Otherwise it will not save correctly, or in a different format. The savefig() function works for many types of files, not just PNGs.
Secondly, if you pass in the file name, the saved image will show up where ever your Python script is (same folder). You can pass in a “file-path” instead (including the filename) if you want to save the image in a specific folder.
Here is a complete example that you can try running on your systems.
from matplotlib import pyplot as plt
import numpy as np
mu, sigma = 100, 15
x = mu + sigma * np.random.randn(10000)
fig, ax = plt.subplots()
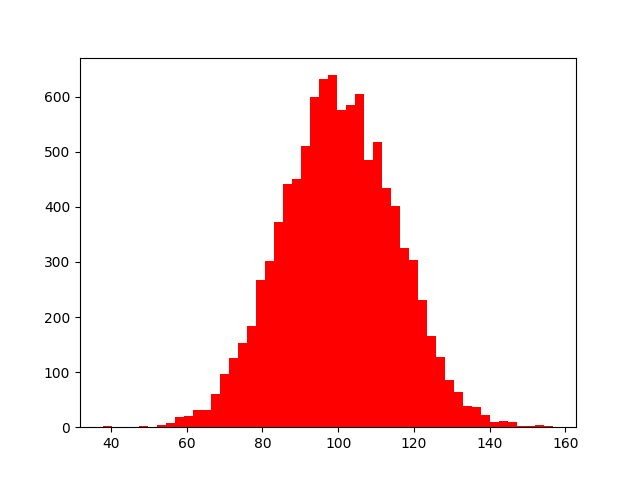
ax.hist(x, bins=50, color="red")
plt.savefig("myPNG.png")
plt.show()Here is the output image from the above code:
Adjusting DPI
You can set the “DPI” which controls the “resolution” of the graph (Dots per Inch). By default the DPI value is set to that of the Matplotlib figure it is saving.
You can provide a custom DPI however, as shown below.
plt.savefig("mySVG.png", dpi = 100)A lower DPI results in a lower resolution image, that takes up less space.
plt.savefig("mySVG.png", dpi = 300)A higher DPI image has better resolution, at the cost of extra space.
Common Issues
Empty Image Problem: Make sure to call the savefig() function before you call the plt.show() function. This is because plt.show() clears the graph once you close the window, which results in an empty graph being saved (as savefig() will get called only after the window is closed, since show() is a blocking function call).
Extra Whitespace Problem: Matplotlib by default has alot of extra whitespace and padding around the saved image, which results in the image looking much bigger than it actually is. You can resolve it using an extra parameter in the savefig() function as shown below.
plt.savefig('myimage.png', bbox_inches='tight')This marks the end of the How to save Matplotlib graphs as PNG images Tutorial. Any suggestions or contributions for CodersLegacy are more than welcome. Questions regarding the tutorial content can be asked in the comments section below.