
Arrowstyles are an important part of annotating graphs in Matplotlib. They control the look and feel of the arrow and annotation by offering a variety of different “styles” for the arrow and arrowheads. In this tutorial we will discuss these various arrowstyles and show you how to customize them in Matplotlib.
List of Matplotlib Arrowstyles (with Parameters)
Here is a list of all available arrowstyles in matplotlib. Each arrow style can further be customized by modifying its default parameters, which control the arrowhead length, arrowhead width, angles for the line (for the curved arrowstyles) and the width of the arrow shaft.
Each arrowstyle has a different set of parameters, so use the following table as reference.
| ArrowStyles | Parameters |
|---|---|
- | None |
-> | head_length=0.4, head_width=0.2 |
-[ | widthB=1.0, lengthB=0.2, angleB=None |
|-| | widthA=1.0, widthB=1.0 |
-|> | head_length=0.4, head_width=0.2 |
<- | head_length=0.4, head_width=0.2 |
<-> | head_length=0.4, head_width=0.2 |
<|- | head_length=0.4, head_width=0.2 |
<|-|> | head_length=0.4, head_width=0.2 |
fancy | head_length=0.4, head_width=0.4, tail_width=0.4 |
simple | head_length=0.5, head_width=0.5, tail_width=0.2 |
wedge | tail_width=0.3, shrink_factor=0.5 |
Matplotlib Arrowstyles Examples
Here are some examples of how matplotlib arrowstyles are used, and how you can modify and customize them by changing the default parameters.
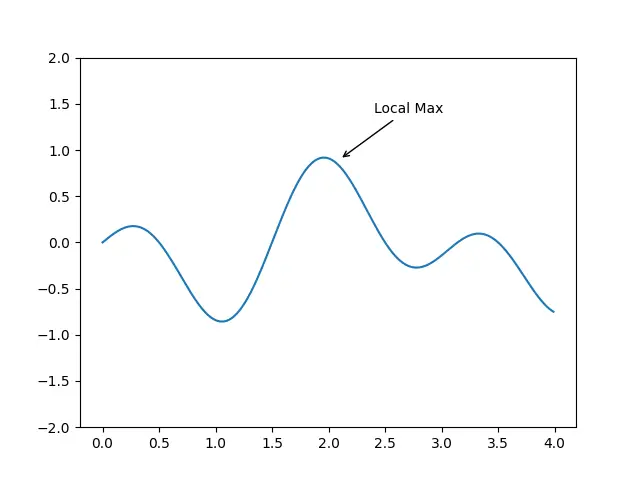
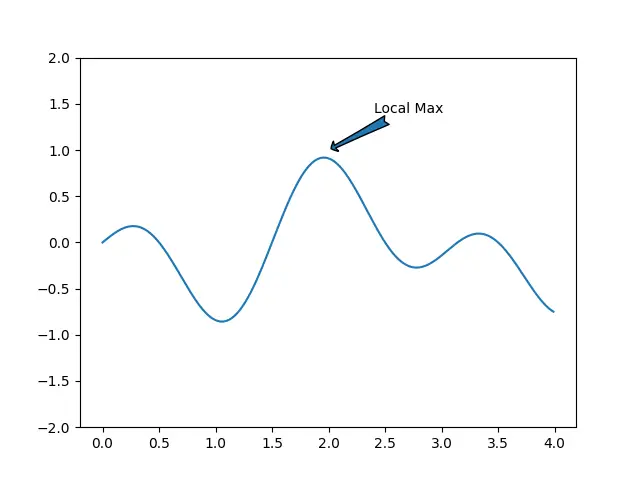
Here is our first example with the default arrow style value of “->”. Refer to the above table for its parameters and their default values.
import matplotlib.pyplot as plt
import numpy as np

fig, ax = plt.subplots()

x = np.arange(0.0, 4.0, 0.01)
y = np.cos(np.pi * x) * np.sin(x)

arrow = ax.annotate('Local Max',
              xy =(2.1, 0.9),
              xytext =(2.4, 1.4),
              arrowprops = dict(arrowstyle="->"))


ax.set_ylim(-2, 2)
plt.plot(x, y)
plt.show()
If you want to learn more about annotations or arrowprops, refer to this tutorial.
Example#2
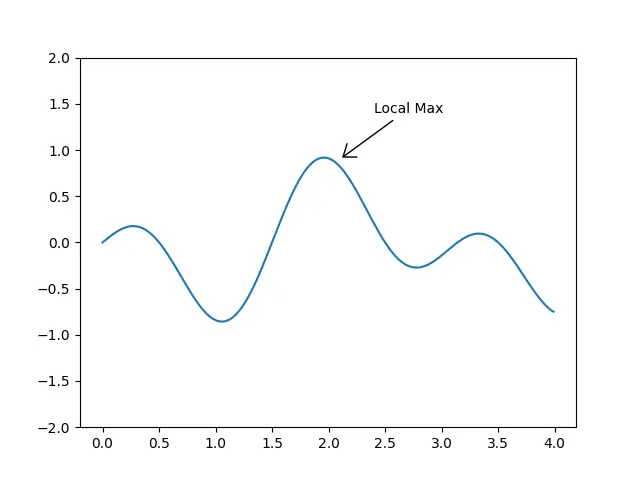
Here we will customize the arrowhead width and length to make it a bit larger.
arrow = ax.annotate('Local Max',
              xy =(2.1, 0.9),
              xytext =(2.4, 1.4),
              arrowprops = dict(
                arrowstyle="->,head_width=0.6,head_length=0.8"
              ))
If you compare this graph to the previous one, you can see an obvious difference in the arrowhead size, which is much more prominent now.
Example#3
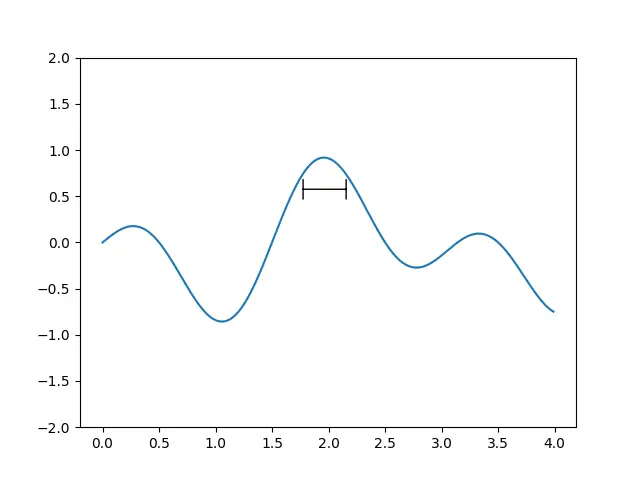
Changing the arrowhead is not always for aesthetic purposes. Sometimes it changes the way the annotation is used on the graph.
arrow = ax.annotate('',
              xy =(1.75, 0.575),
              xytext =(2.18, 0.575),
              arrowprops = dict(
                arrowstyle="|-|,widthA=0.7, widthB=0.7"
              ))
We reduced the size of the bars a little to fit our plot.
Example#4
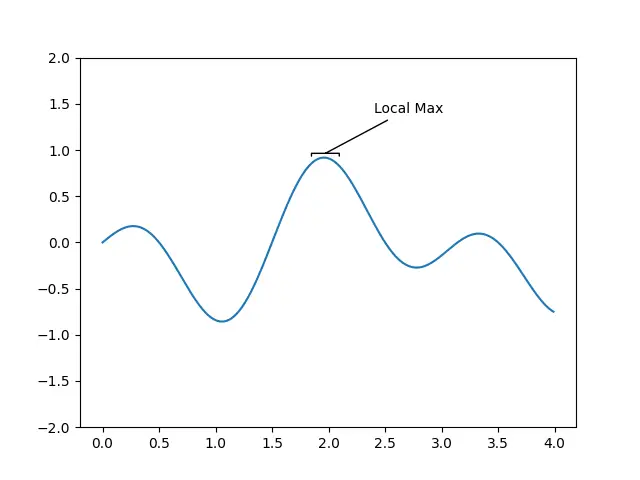
Some more interesting arrowheads do not even involve arrows. You can change the angle parameter to better fit your plot.
arrow = ax.annotate('Local Max',
              xy =(1.95, 0.95),
              xytext =(2.4, 1.4),
              arrowprops = dict(
                arrowstyle="-[, angleB=62"
              ))
Example#5
Another special type of arrowstyle is “fancy”. It produces a very unique and good looking arrow. We modified the head and tail widths to increase the size a little.
arrow = ax.annotate('Local Max',
              xy =(2, 1),
              xytext =(2.4, 1.4),
              arrowprops = dict(
                arrowstyle="fancy,head_width=0.8,tail_width=0.7"
              ))
This marks the end of the Customize arrowstyles in Matplotlib Tutorial. Any suggestions or contributions for CodersLegacy are more than welcome. Questions regarding the tutorial content can be asked in the comments section below.