
mplcursors is a Python library that allows you to add interactive data cursors to Matplotlib plots. These data cursors display information about specific data points when you hover your mouse over them, making it easier to explore and analyze your data. In this tutorial, you’ll learn how to install and use mplcursors to enhance your Matplotlib plots.
Prerequisites
Before you begin, make sure you have the following prerequisites installed:
- Python: You should have Python 3.x installed on your system.
- Matplotlib: You need Matplotlib, which is one of the most widely used Python libraries for data visualization. You can install it using pip if you haven’t already:
pip install matplotlib- mplcursors: You can easily install mplcursors using the pip command:
pip install mplcursors
Creating a Simple Matplotlib Plot
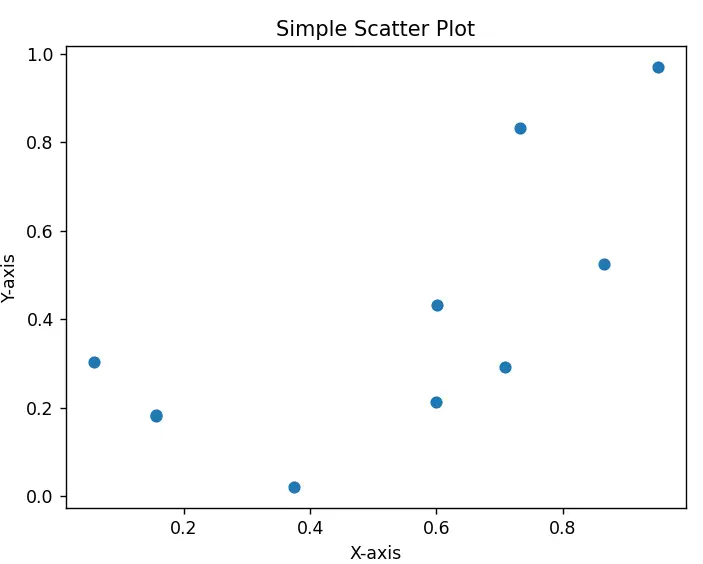
Let’s start by creating a simple Matplotlib plot to work with. In this example, we’ll create a basic scatter plot with random data points:
import matplotlib.pyplot as plt
import numpy as np

# Generate random data
np.random.seed(42)
x = np.random.rand(10)
y = np.random.rand(10)

# Create a scatter plot
plt.scatter(x, y)
plt.xlabel('X-axis')
plt.ylabel('Y-axis')
plt.title('Simple Scatter Plot')
plt.show()
Now, we have a basic scatter plot. To add interactivity with mplcursors, we’ll need to modify our code.
Adding mplcursors to Your Plot
To enhance our plot with mplcursors, follow these steps:
- Import the
mplcursorslibrary. - Use the
mplcursors.cursor()function to enable cursor tooltips on your plot.
Here’s the updated code:
import matplotlib.pyplot as plt
import numpy as np
import mplcursors
# Generate random data
np.random.seed(42)
x = np.random.rand(10)
y = np.random.rand(10)
# Create a scatter plot
plt.scatter(x, y)
plt.xlabel('X-axis')
plt.ylabel('Y-axis')
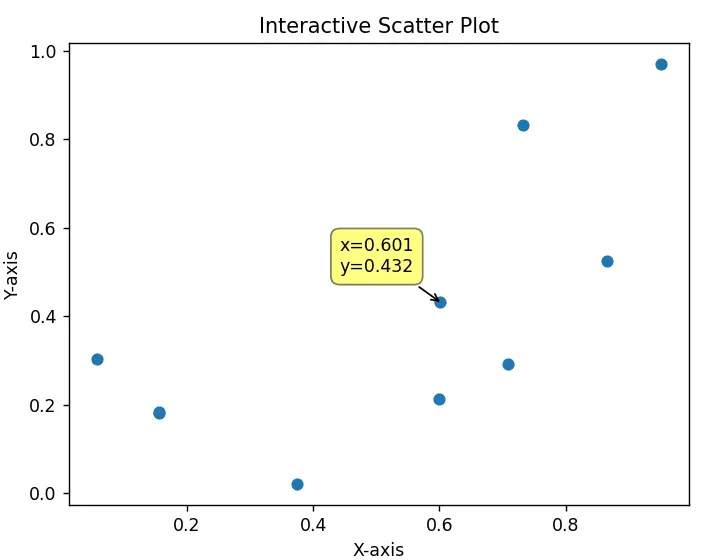
plt.title('Interactive Scatter Plot')
# Enable mplcursors
mplcursors.cursor(hover=True)
plt.show()
Now, if you run this code, you’ll notice that when you hover your mouse over the data points in the scatter plot, tooltips will appear, displaying the x and y values of each point.
Disabling Hover Effects
Alternatively you can disable the “hover” ability, and change the trigger action from a mouse hover, to a mouse click instead. All you have to is pass false to the hover parameter, or exclude it entirely.
mplcursors.cursor(hover=True)
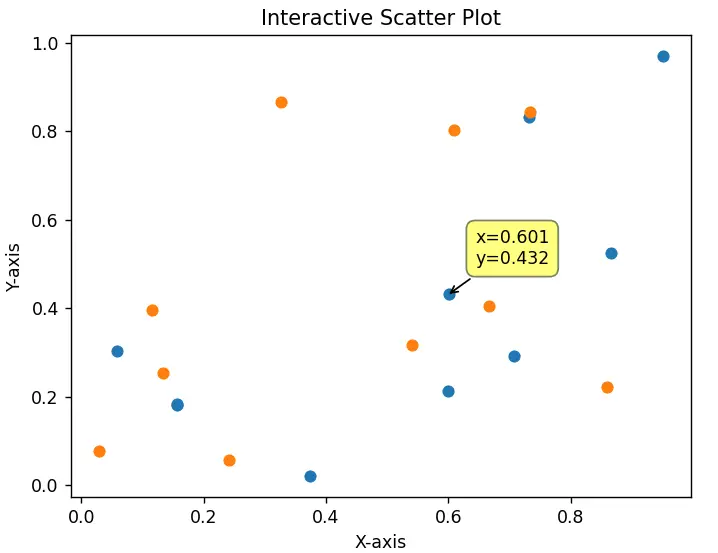
Enabling mplcursors on a Subset of Data
If you have multiple artists (plots) on your matplotlib graph, you may want to only able the interactive cursors on a certain plot/artist, not all of them. This can easily be done, by explicitly passing the artists/plots to the first parameter of the mplcursors.cursor() function.
import matplotlib.pyplot as plt
import numpy as np
import mplcursors

# Generate and plot random data 1
np.random.seed(42)
x = np.random.rand(10)
y = np.random.rand(10)
scatter1 = plt.scatter(x, y)

# Generate and plot random data 2
np.random.seed(43)
x = np.random.rand(10)
y = np.random.rand(10)
scatter2 = plt.scatter(x, y)

# Enable mplcursors
mplcursors.cursor(scatter1, hover=True)

plt.xlabel('X-axis')
plt.ylabel('Y-axis')
plt.title('Interactive Scatter Plot')
plt.show()
Here is the output:
This marks the end of the mplcursors tutorial. Any suggestions or contributions for CodersLegacy are more than welcome. Questions regarding the tutorial content can be asked in the comments section below.