
In this Matplotlib tutorial we will explore the use of the Button widget and how we can use it effectively through various example codes and images.
Creating a Button Widget in Matplotlib
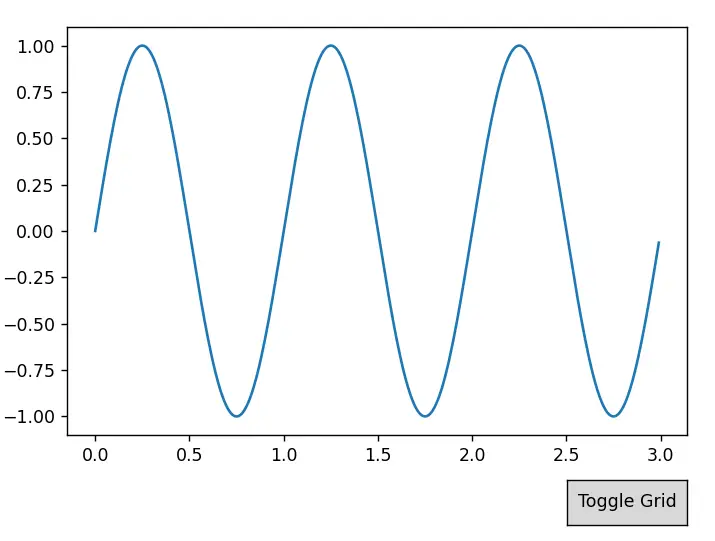
A common usage for buttons is to “toggle” a certain feature on and off. Let us try and replicate this behavior, by making a button which toggles the “grid” on our Graph on and off (the grid is disabled by default).
First we setup our basic code, where make our imports, generate our data (for a sin wave), and then plot our data.
import numpy as np
import matplotlib.pyplot as plt
from matplotlib.widgets import Button

# data creation
x = np.arange(0.0, 3.0, 0.01)
y = np.sin(2*np.pi*x)

# plotting data
fig, ax = plt.subplots()
l, = ax.plot(x, y)
This gives us a simple sin wave as our output.
Now we need to focus on adding in a Button widget to our Matplotlib Graph. But before we do this, we need to actually make some space for it. We want to place our button somewhere near the bottom, so we will free up a little space down there by using the subplots_adjust() method.
plt.subplots_adjust(bottom = 0.2)
This method moves the graph up by about 20% (values range from 0 to 1). We now have some free space.
We will create a new axes object, called buttonax using the add_axes() method. This method takes a list as a parameter, with 4 arguments. The x-offset, y-offset, width and height respectively. All values range from 0 to 1.
toggle = False
buttonax = fig.add_axes([0.75, 0.05, 0.15, 0.075])
button = Button(buttonax, 'Toggle Grid')
button.on_clicked(toggleGrid)

plt.show()
After this we create our button widget, and then connect our button to the toggle function (which we will define in the next step).
def toggleGrid(event):
    global toggle
    toggle = not(toggle)
    ax.grid(toggle)
    plt.draw()
Just remember to place the toggle button above the button widget declaration.
Here is the complete code for your convenience, along with two images for the output (before clicking button, and after).
import numpy as np
import matplotlib.pyplot as plt
from matplotlib.widgets import Button

# data creation
x = np.arange(0.0, 3.0, 0.01)
y = np.sin(2*np.pi*x)

# plotting data
fig, ax = plt.subplots()
l, = ax.plot(x, y)
plt.subplots_adjust(bottom = 0.2)

def toggleGrid(event):
    global toggle
    toggle = not(toggle)
    ax.grid(toggle)
    plt.draw()

toggle = False
buttonax = fig.add_axes([0.75, 0.05, 0.15, 0.075])
button = Button(buttonax, 'Toggle Grid')
button.on_clicked(toggleGrid)

plt.show()
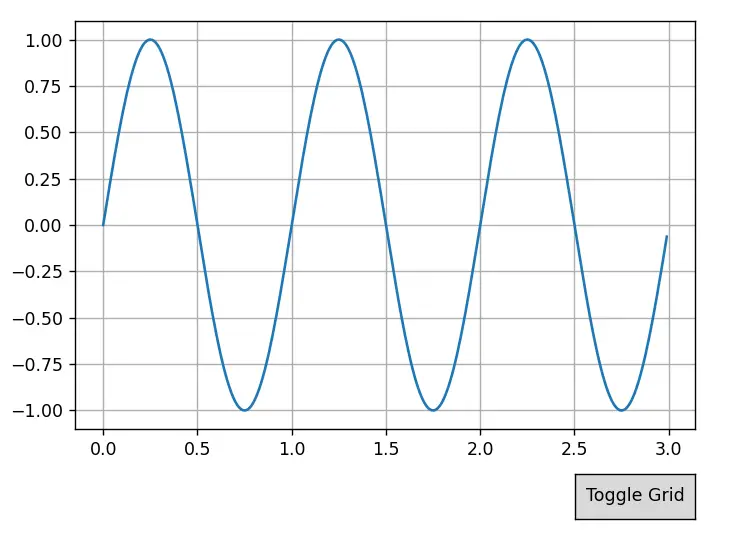
After clicking the button:
Switching between Graphs with Button Widget
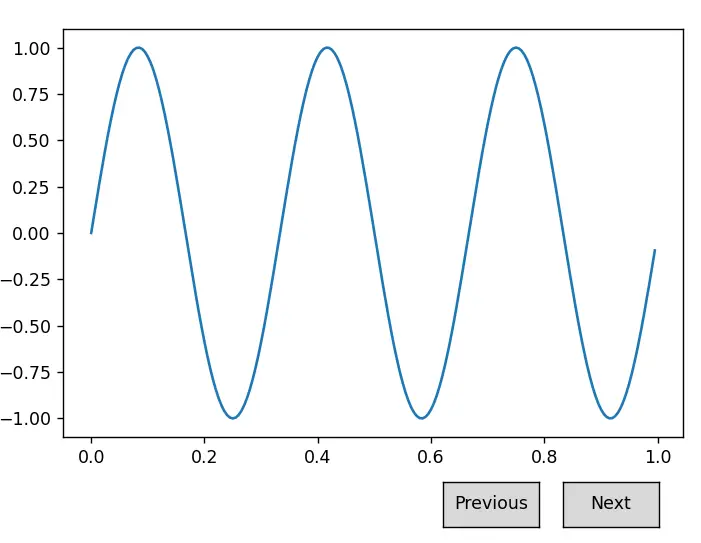
Here is a nice example from the official matplotlib documentation. It is effectively being used to switch between different graphs. Each graph is basically a sin graph (sin wave) at a different frequency.
import numpy as np
import matplotlib.pyplot as plt
from matplotlib.widgets import Button

freqs = np.arange(1, 6, 1)
fig, ax = plt.subplots()
fig.subplots_adjust(bottom=0.2)

x = np.arange(0.0, 1.0, 0.005)
y = np.sin(2*np.pi*freqs[0]*x)
l, = ax.plot(x, y)

ind = 0

def next(event):
    global ind
    ind += 1
    i = ind % len(freqs)

    ydata = np.sin(2*np.pi*freqs[i]*x)
    l.set_ydata(ydata)
    plt.draw()


def prev(event):
    global ind
    ind -= 1
    i = ind % len(freqs)

    ydata = np.sin(2*np.pi*freqs[i]*x)
    l.set_ydata(ydata)
    plt.draw()


axprev = fig.add_axes([0.60, 0.05, 0.12, 0.075])
axnext = fig.add_axes([0.75, 0.05, 0.12, 0.075])
bnext = Button(axnext, 'Next')
bnext.on_clicked(next)
bprev = Button(axprev, 'Previous')
bprev.on_clicked(prev)

plt.show()
To briefly sum up what’s going on here, first we create an array of frequencies (e.g 6 different frequencies), then we initially draw a graph using the first frequency in this array. We create two buttons, and one axes for each of them.
Each button is connected to a function, which is responsible for incrementing the index variable (which tracks the currently displayed graph), updating the data, and redrawing the plot. Because we are using modulus, the index variable just loops around after it reaches its end.
Here is an image of the graph after we clicked the button twice.
Class based Implementation
Here we have a Class-based implementation of our code from earlier. Using a Class we can avoid the use of a global variable, instead wrapping both functions and the index variable in a single Class.
import numpy as np
import matplotlib.pyplot as plt
from matplotlib.widgets import Button

freqs = np.arange(1, 6, 1)
fig, ax = plt.subplots()
fig.subplots_adjust(bottom=0.2)

x = np.arange(0.0, 1.0, 0.005)
y = np.sin(2*np.pi*freqs[0]*x)
l, = ax.plot(x, y)

class ButtonIndex:
    def __init__(self):
        self.ind = 0

    def next(self, event):
        self.ind += 1
        i = self.ind % len(freqs)
        ydata = np.sin(2*np.pi*freqs[i]*x)
        l.set_ydata(ydata)
        plt.draw()


    def prev(self, event):
        self.ind -= 1
        i = self.ind % len(freqs)
        ydata = np.sin(2*np.pi*freqs[i]*x)
        l.set_ydata(ydata)
        plt.draw()


axprev = fig.add_axes([0.60, 0.05, 0.12, 0.075])
axnext = fig.add_axes([0.75, 0.05, 0.12, 0.075])

buttonIndex = ButtonIndex()
bnext = Button(axnext, 'Next')
bnext.on_clicked(buttonIndex.next)
bprev = Button(axprev, 'Previous')
bprev.on_clicked(buttonIndex.prev)
plt.show()
If you are feeling very adventurous, you could extend the Button Class itself by creating an inherited class and adding an index attribute and the required functions there. This would allow you to keep the number of active objects and entities minimized.
Head over to our Matplotlib Widgets page to learn more about the various widgets and how to use them!
This marks the end of the Matplotlib Button Widget Tutorial. Any suggestions or contributions for CodersLegacy are more than welcome. Questions regarding the tutorial content can be asked in the comments section below.