In this Tutorial we will briefly discuss 6 of the most popular widgets in Matplotlib, complete with proper examples and sample codes. Each widget in Matplotlib is a proper GUI element which the user can interact with to perform a certain action. For example, pressing a button to change the currently displayed graph.
Matplotlib Button
Here is a nice example from the official matplotlib documentation. The Button widget is effectively being used to switch between different graphs. Each graph is basically a sin graph (sin wave) at a different frequency.
Every time we click the button, we update the y-axis data with a higher frequency sin wave. We need to ensure that we can “loop” back around to the original frequency, so we keep a global index variable which helps us do this. We will also introduce two buttons, to allow us to go back and forth as we wish.
import numpy as np
import matplotlib.pyplot as plt
from matplotlib.widgets import Button

freqs = np.arange(1, 6, 1)
fig, ax = plt.subplots()
fig.subplots_adjust(bottom=0.2)

x = np.arange(0.0, 1.0, 0.005)
y = np.sin(2*np.pi*freqs[0]*x)
l, = ax.plot(x, y)

ind = 0

def next(event):
    global ind
    ind += 1
    i = ind % len(freqs)

    ydata = np.sin(2*np.pi*freqs[i]*x)
    l.set_ydata(ydata)
    plt.draw()


def prev(event):
    global ind
    ind -= 1
    i = ind % len(freqs)

    ydata = np.sin(2*np.pi*freqs[i]*x)
    l.set_ydata(ydata)
    plt.draw()


axprev = fig.add_axes([0.60, 0.05, 0.12, 0.075])
axnext = fig.add_axes([0.75, 0.05, 0.12, 0.075])
bnext = Button(axnext, 'Next')
bnext.on_clicked(next)
bprev = Button(axprev, 'Previous')
bprev.on_clicked(prev)

plt.show()

Interested in learning more about the Button Widget? Follow the link for more!
Matplotlib Slider
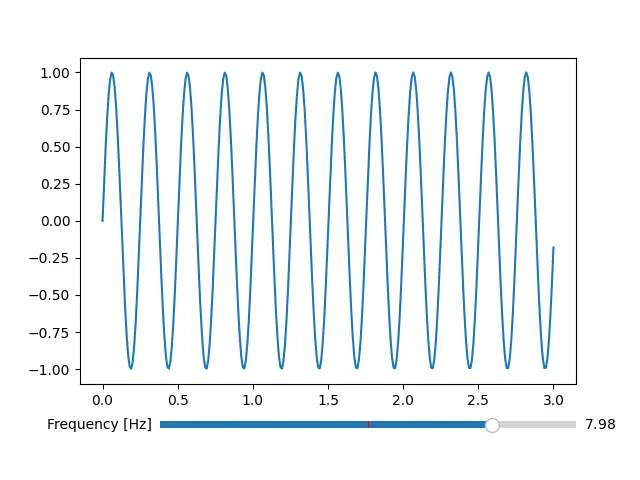
The Slider widget presents to the user a interactable slider which can be used to select a value from a predefined range of values. This range of values can be both discrete and continuous, depending on our needs.
Our goal is to add a slider widget that allows us to control the frequency of the sin wave that we have plotted in the below graph. Whenever we move the Slider, a function is called (which we explicitly define), and we update our graph with the new values.
import numpy as np
import matplotlib.pyplot as plt
from matplotlib.widgets import Slider

x = np.linspace(0, 3, 300)
y = np.sin(5 * np.pi * x)

fig, ax = plt.subplots()
fig.subplots_adjust(bottom=0.2)
l, = ax.plot(x, y)

def onChange(value):
    l.set_ydata(np.sin(value * np.pi * x))
    fig.canvas.draw_idle()

slideraxis = fig.add_axes([0.25, 0.1, 0.65, 0.03])
slider = Slider(slideraxis, label='Frequency [Hz]',
                valmin=0, valmax=10, valinit=5)
slider.on_changed(onChange)
plt.show()

Interested in learning more about the Slider Widget? Follow the link for more!
Matplotlib Textbox
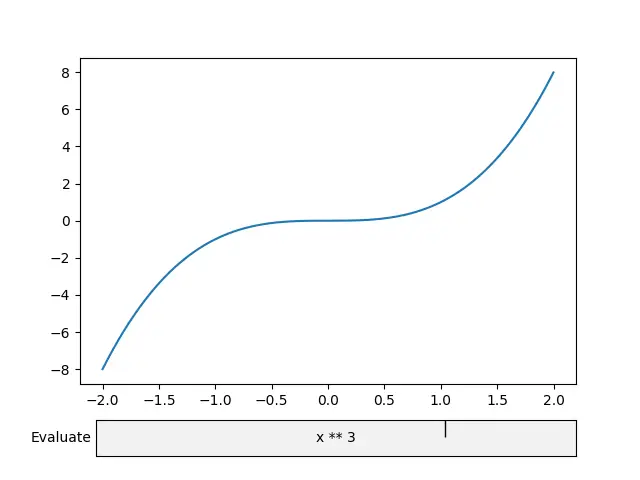
For the TextBox widget, we will take a look at some sample code from the official matplotlib documentation. To sum it up briefly, it creates a simple textbox widget which takes an “expression” for a graph (like x^2 or x+5). This expression is evaluated by Python functions, which return the values that we require. We then plot these values onto our Matplotlib window to produce the appropriate graph.
import numpy as np
import matplotlib.pyplot as plt
from matplotlib.widgets import TextBox


fig, ax = plt.subplots()
fig.subplots_adjust(bottom=0.2)

t = np.arange(-2.0, 2.0, 0.001)
l, = ax.plot(t, np.zeros_like(t))


def submit(expression):
    # Calculate y-axis data and update plot
    ydata = eval(expression)
    l.set_ydata(ydata)

    # Rescale graph to fit new data
    ax.relim()
    ax.autoscale_view()

    # Draw changes to Plot
    plt.draw()


axbox = fig.add_axes([0.15, 0.05, 0.75, 0.075])
textbox = TextBox(axbox, "Evaluate", textalignment="center")
textbox.on_submit(submit)
textbox.set_val("t ** 2")  # Trigger `submit` with the initial string.

plt.show()

Interested in seeing more examples for the Textbox Widget? Follow the link for more!
Matplotlib RadioButton Widget
The RadioButton widget presents to the user a list of options, from which one can be selected. Only one option may be selected at any given point. Selecting a new option will automatically deselect the previously selected option.
The code features a “Color Changer” for our graph. The RadioButton will display a bunch of color options, and selecting any option will change the graph to that corresponding color.
import numpy as np
import matplotlib.pyplot as plt
from matplotlib.widgets import RadioButtons

# data creation
x = np.arange(0.0, 3.0, 0.01)
y = np.sin(2*np.pi*x)

# plotting data
fig, ax = plt.subplots()
l, = ax.plot(x, y)
plt.subplots_adjust(left = 0.3)

# creating radio buttons
rax = plt.axes([0.05, 0.5, 0.15, 0.30])
radio = RadioButtons(rax, labels = ['red', 'blue', 'green'],
                          active=2,
                          activecolor='yellow')
l.set_color(radio.value_selected)

def color(label):
    l.set_color(label)
    fig.canvas.draw()

radio.on_clicked(color)
plt.show()

Interested in learning more about the RadioButton Widget? Follow the link for more!
Matplotlib CheckBox Widget
“CheckBox” is very popular name for this type of widget, but the actual name used in Matplotlib is CheckButtons, so don’t get confused.
The CheckButton or “CheckBox” is a simple widget, which presents to the User several options from which they may select some, all or none of the options. A very similar counterpart to this widget is the “Radio Button“.
The Goal of this code right here, is to use CheckButtons to toggle various graphs on and off. We will have a total of three graphs, and we can use CheckBoxes to decide which graphs will be displayed.
import numpy as np
import matplotlib.pyplot as plt
from matplotlib.widgets import CheckButtons

x = np.arange(0.0, 3.0, 0.01)
y1 = np.sin(1 * np.pi * x)
y2 = np.sin(2 * np.pi * x)
y3 = np.sin(4 * np.pi * x)

fig, ax = plt.subplots()
l1, = ax.plot(x, y1, color='blue', label='1 Hz')
l2, = ax.plot(x, y2, visible=False, color='red', label='2 Hz')
l3, = ax.plot(x, y3, color='green', label='4 Hz')
lines = [l1, l2, l3]
fig.subplots_adjust(left=0.25)


rax = fig.add_axes([0.025, 0.4, 0.1, 0.2])
labels = [str(line.get_label()) for line in lines]
visible = [line.get_visible() for line in lines]
check = CheckButtons(rax, labels, visible)


def handleClick(label):
    index = labels.index(label)
    lines[index].set_visible(not lines[index].get_visible())
    plt.draw()

check.on_clicked(handleClick)
plt.show()

Interested in learning more about the CheckBox Widget? Follow the link for more!
Matplotlib Cursor
This widget does not provide any extra functionality, rather it serves as a visual guide for you by providing a “cross-chair” of sorts to help you navigate with your mouse cursor. It’s best use is when paired with a feature like the “Pick” event which requires you to navigate to and click on plotted objects. The Cursor widget makes it easier to locate and accurately click on these objects.
from matplotlib.widgets import Cursor
import numpy as np
import matplotlib.pyplot as plt

def onpick(event):
    print(event.artist.get_data())

fig, ax = plt.subplots(figsize=(8, 6))
x, y = 4*(np.random.rand(2, 100) - .5)

for i in range(len(x)):
    ax.plot(x[i], y[i], 'o', picker=True, color="blue")
ax.set_xlim(-2, 2)
ax.set_ylim(-2, 2)


cursor = Cursor(ax, useblit=True, color='red', linewidth=2)
fig.canvas.mpl_connect('pick_event', onpick)
plt.show()

Interested in learning more about the Cursor Widget? Follow the link for more!
This marks the end of the Matplotlib Widgets Tutorial. Any suggestions or contributions for CodersLegacy are more than welcome. Questions regarding the tutorial content can be asked in the comments section below.
