
In this Matplotlib Tutorial we will discuss how to create and use the CheckBox Widget through the use of example codes and images. “CheckBox” is very popular name for this type of widget, but the actual name used in Matplotlib is CheckButtons, so don’t get confused.
The CheckButton or “CheckBox” is a simple widget, which presents to the User several options from which they may select some, all or none of the options. A very similar counterpart to this widget is the “Radio Button“.
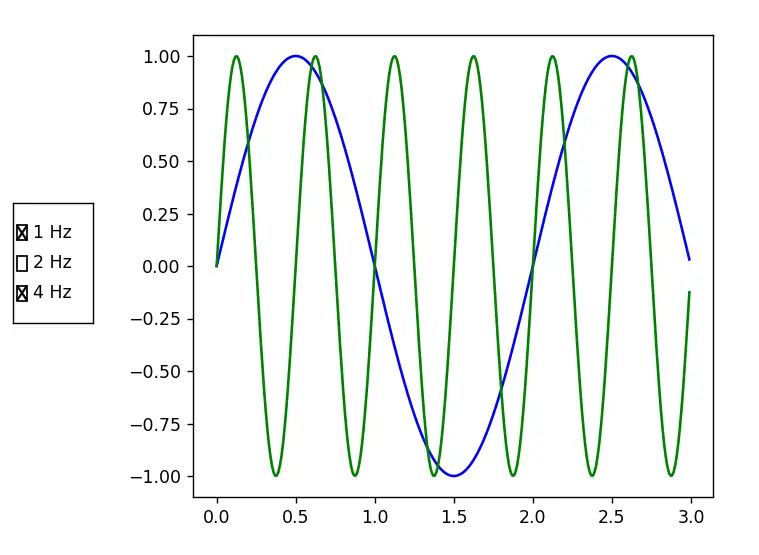
The Goal of this tutorial is to use CheckButtons to toggle various graphs on and off. We will have a total of three graphs, and we can use CheckBoxes to decide which graphs will be displayed.
How to create a CheckBox in Matplotlib
The first thing we need to do is make a few imports. We will import the numpy module for generating data for our plot, import the pyplot module from matplotlib for plotting purpose, and import the CheckButton widget from the widgets module in Matplotlib.
import numpy as np
import matplotlib.pyplot as plt
from matplotlib.widgets import CheckButtons
Next we generate data using Numpy. We will be generating three different graphs, each representing the Sin wave at a different frequency. They all share the same x-axis data though, so no need to create three of those.
x = np.arange(0.0, 3.0, 0.01)
y1 = np.sin(1 * np.pi * x)
y2 = np.sin(2 * np.pi * x)
y3 = np.sin(4 * np.pi * x)
Now we need to plot this data. First we create our fig and axis object using subplots() After this we plot three graphs by calling the plot() method three times with the appropriate data. We also specify the color for each graph and give it a label. This will be quite important later on when creating the CheckButton.
fig, ax = plt.subplots()
l1, = ax.plot(x, y1, color='blue', label='1 Hz')
l2, = ax.plot(x, y2, visible=False, color='red', label='2 Hz')
l3, = ax.plot(x, y3, color='green', label='4 Hz')
lines = [l1, l2, l3]
We will also store the return objects from the plot() function in an array called lines. We will be needing this later too. It is important to note that the second plot is not visible by default (it is hidden).
One slight problem we have right now that there is no space for the CheckBox anywhere on the graph. Right now the graph takes up 100% of the window. We could draw the checkbox somewhere inside the graph, but this leads to a high chance of it covering up some of the graph.
fig.subplots_adjust(left=0.25)
To resolve this problem, we will use the subplots_adjust() to move the left offset from 0 to 0.25 (possible values ranging from 0 to 1). We now have about 25% of the window (from the left) free.
Creating a new Axes for CheckButtons
We will now create a new axes object called rax, and place it within this newly freed up region using the add_axes() method belonging to the fig object. It takes a list as a parameter, where the first and second values represent the x and y starting positions (values ranging from 0 to 1). The third and fourth values represent the width and height respectively.
rax = fig.add_axes([0.025, 0.4, 0.1, 0.2])
labels = [str(line.get_label()) for line in lines]
visibility = [line.get_visible() for line in lines]
The labels and visibility lists are created using list comprehension by getting the labels and visibility status from each of our plots. The visibility status is a Boolean value of either True or False. Default visibility status is True.
check = CheckButtons(rax, labels, visibility)
We have created three entities so far, a new axes, a labels list and a visible status list. These three are used as the arguments to the Matplotlib CheckBuutton widget as shown above.
def handleClick(label):
    index = labels.index(label)
    lines[index].set_visible(not lines[index].get_visible())
    plt.draw()

check.on_clicked(handleClick)
plt.show()
Finally we define the handleClick() function. If we pass this function name to the on_clicked() method, it will be called whenever any of the options in the CheckBox are clicked. The label of the clicked option is passed in automatically to this function. We can use this label to toggle the visibility of that option.
Here is the complete code with the output.
import numpy as np
import matplotlib.pyplot as plt
from matplotlib.widgets import CheckButtons

x = np.arange(0.0, 3.0, 0.01)
y1 = np.sin(1 * np.pi * x)
y2 = np.sin(2 * np.pi * x)
y3 = np.sin(4 * np.pi * x)

fig, ax = plt.subplots()
l1, = ax.plot(x, y1, color='blue', label='1 Hz')
l2, = ax.plot(x, y2, visible=False, color='red', label='2 Hz')
l3, = ax.plot(x, y3, color='green', label='4 Hz')
lines = [l1, l2, l3]
fig.subplots_adjust(left=0.25)


rax = fig.add_axes([0.025, 0.4, 0.1, 0.2])
labels = [str(line.get_label()) for line in lines]
visibility = [line.get_visible() for line in lines]
check = CheckButtons(rax, labels, visibility)


def handleClick(label):
    index = labels.index(label)
    lines[index].set_visible(not lines[index].get_visible())
    plt.draw()

check.on_clicked(handleClick)

plt.show()
Try running the code yourself and interacting with the graph!
This marks the end of the Matplotlib CheckBox Widget Tutorial. Any suggestions or contributions for CodersLegacy are more than welcome. Questions regarding the tutorial content can be asked in the comments section below.