
In this Matplotlib tutorial, we will explore how to integrate the RadioButton widget into our Matplotlib graphs. The RadioButton widget presents to the user a list of options, from which one can be selected. Only one option may be selected at any given point. Selecting a new option will automatically deselect the previously selected option. The counter-part to the RadioButton widget, is the CheckBox widget, which offers similar functionality.
Lets explore how we can use the RadioButton widget to enhance our Matplotlib experience with the help of some example codes.
Creating RadioButton Widgets in Matplotlib
Before adding the RadioButton widget, we need to setup a basic plot with some data.
First we will make our necessary imports, and generate some data for us to use using numpy. We will be plotting a simple sin wave on our graph.
import numpy as np
import matplotlib.pyplot as plt
from matplotlib.widgets import RadioButtons

# data creation
x = np.arange(0.0, 3.0, 0.01)
y = np.sin(2*np.pi*x)
After we have generated our data, we can begin creating our Matplotlib figure, and plotting our data.
First, create the figure and axes object using plt.subplots() or any other equivalent method. Next, call the plot() method with the x and y data we generated earlier as an argument.
# plotting data
fig, ax = plt.subplots()
l, = ax.plot(x, y)
plt.show()
We now have a simple plot setup. Our goal for the RadioButton, will be to make a “Color Changer” for our graph. The RadioButton will display a bunch of color options, and selecting any option will change the graph to that corresponding color.
Adding the RadioButton Widget
It’s time to add our RadioButton widget. But first, we need to do make some space for it, as our graph currently occupies the entire window.
plt.subplots_adjust(left = 0.3)
We can do this using the subplots_adjust() method, which can be used to move either the bottom, left, top or right offsets. In our case, we want to place the RadioButtons somewhere to the left, so we will move the left offset of our graph from 0 to 0.3 (max value is 1).
This leaves about 30% of the graph from the left empty for us to use.
We need to create a new axes object now, which occupies this newly freed up space. This can be done using the axes() method on plt or the add_axes() method on the figure object. Both take the same parameters, which is a list containing 4 values, x-offset, y-offset, width and height. Each parameter has a possible value from 0 to 1.
# creating radio buttons
rax = plt.axes([0.05, 0.5, 0.15, 0.30])
radio = RadioButtons(rax, labels=['red','blue','green'])
l.set_color(radio.value_selected)
After this we create the RadioButton widget, using the newly created axes and a list of text labels. We also update the graph with the currently selected (default) value for the RadioButton (usually the first value).
Now we need to define a function, and connect our RadioButton to it.
def color(label):
    l.set_color(label)
    fig.canvas.draw()

radio.on_clicked(color)
plt.show()
Whenever the RadioButton is clicked now, the “color” function will be called. It first updates the color of the graph, and then it redraws the graph to show the new changes.
Code for RadioButton Widget
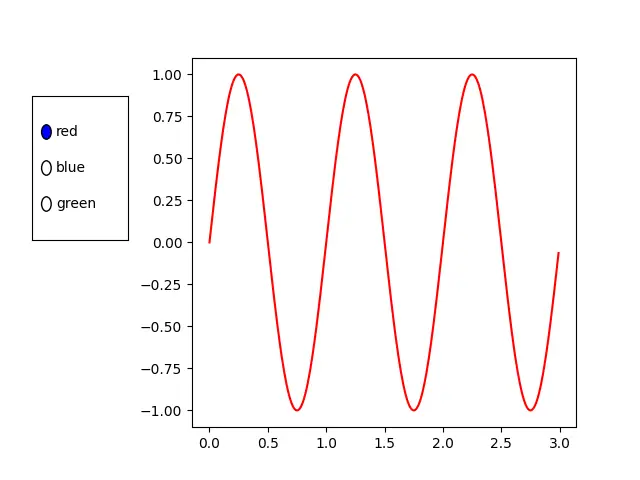
Here is the complete code along with the output.
import numpy as np
import matplotlib.pyplot as plt
from matplotlib.widgets import RadioButtons

# data creation
x = np.arange(0.0, 3.0, 0.01)
y = np.sin(2*np.pi*x)

# plotting data
fig, ax = plt.subplots()
l, = ax.plot(x, y)
plt.subplots_adjust(left = 0.3)

# creating radio buttons
rax = plt.axes([0.05, 0.5, 0.15, 0.30])
radio = RadioButtons(rax, labels=['red','blue','green'])
l.set_color(radio.value_selected)

def color(label):
    l.set_color(label)
    fig.canvas.draw()

radio.on_clicked(color)
plt.show()
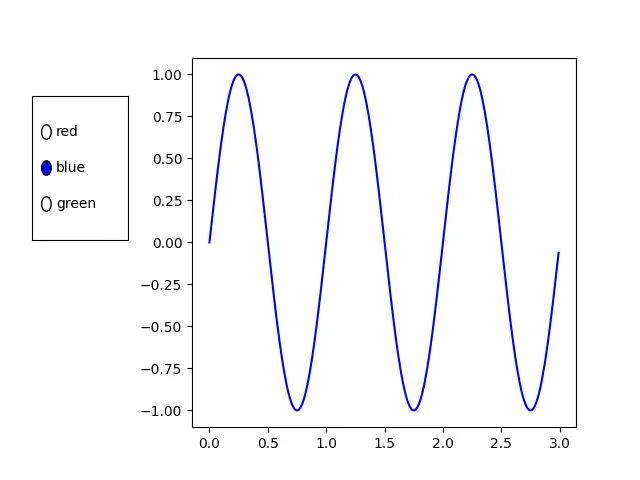
After clicking on the second option:
Change currently active option
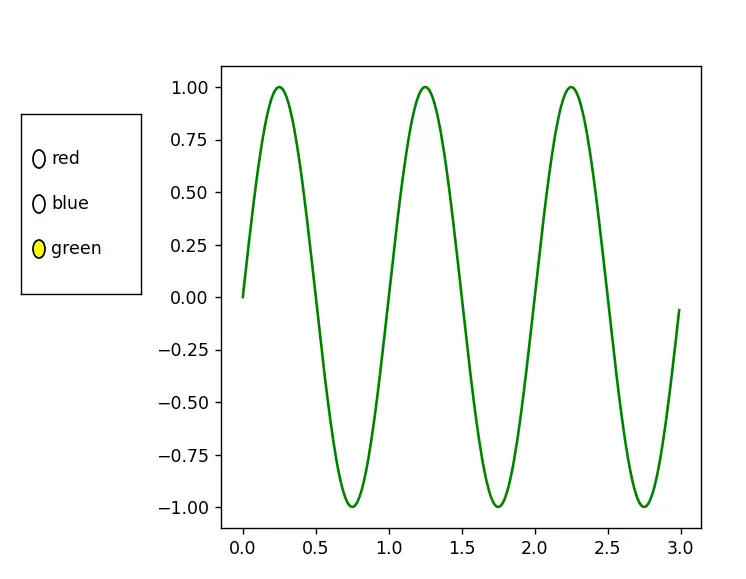
There are a few extra parameters that we can take advantage of in the RadioButtons Class. The “active” parameter can be used to set some other value as the default option. By default the first value is the “active” one. If you run the code with the below modification, you will notice that the default color is now green (labels[2]).
radio = RadioButtons(rax, labels = ['red', 'blue', 'green'],
                          active=2,
                          activecolor='yellow')
The activecolor parameter controls the color of the “circle” next to the options. By default it is a shade of blue. You can change this any color of your choosing (that matplotlib supports).
You can also set the currently active index using the set_active(index) method on the RadioButton object.
This marks the end of the Matplotlib RadioButton Widget Tutorial. Any suggestions or contributions for CodersLegacy are more than welcome. Questions regarding the tutorial content can be asked in the comments section below.