
In this tutorial we will cover the Matplotlib Cursor Widget. This widget does not provide any extra functionality, rather it serves as a visual guide for you by providing a “cross-chair” of sorts to help you navigate with your mouse cursor.
In this tutorial we will explore how to create the Cursor widget, and show an example of how it can be useful.
Creating a Cursor in Matplotlib
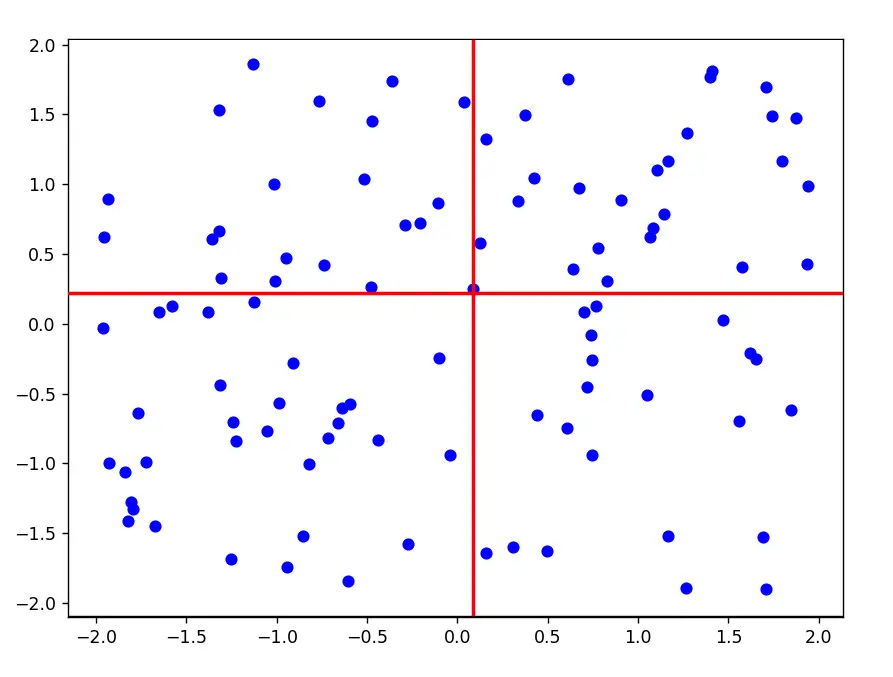
Setting up a Cursor widget is actually very simple, and requires just a single step. All you need to do is create a Cursor object using the Cursor Class from the Matplotlib widgets module. If you pass in the correct parameters, the cursor object will automatically appear on screen.
from matplotlib.widgets import Cursor
import numpy as np
import matplotlib.pyplot as plt

fig, ax = plt.subplots(figsize=(8, 6))
x, y = 4*(np.random.rand(2, 100) - .5)

ax.plot(x, y, 'o')

cursor = Cursor(ax, useblit=True, color='red', linewidth=2)
plt.show()
Let us try to make this Graph more realistic by adding some purpose to it. We will make use of the “Picker” Event in Matplotlib, to make the “plotted points” interactable. This is a special feature that allows us to actually trigger a function whenever we click on a plotted object in the Matplotlib window.
This requires two steps to be activated. First we pass in the picker parameter to the plot() function when plotting our data.
ax.plot(x, y, 'o', picker=True)
Next, we need to connect the picker event to our graph, and a corresponding function which will activate when the event is triggered.
fig.canvas.mpl_connect('pick_event', onpick)
onpick() is the name of the function that we will be using. Let us write down the function definition for it.
def onpick(event):
    print(event.artist.get_data())
As you can see here, it is automatically passed in an “event” parameter which contains information about the event. We can use the artist attribute to get the plotted object, and then we can use the get_data() method on our plotted object to retrieve its coordinates.
The entire point of making these changes, is so that the Cursor object has some meaning. Normally selecting tiny dots on a graph can be a little tricky. But the Cursor object can actually help us over here.
Here is the complete code with all these new additions.
from matplotlib.widgets import Cursor
import numpy as np
import matplotlib.pyplot as plt

def onpick(event):
    print(event.artist.get_data())

fig, ax = plt.subplots(figsize=(8, 6))
x, y = 4*(np.random.rand(2, 100) - .5)

for i in range(len(x)):
    ax.plot(x[i], y[i], 'o', picker=True, color="blue")

cursor = Cursor(ax, useblit=True, color='red', linewidth=2)
fig.canvas.mpl_connect('pick_event', onpick)
plt.show()
You will observe here that we plotted the data in a rather strange way. We did not plot it at once, rather we iterated over it plotting each point individually. This was because of the nature of “picker” and “matplotlib”.
In Matplotlib, anything plotted using plot() counts as a single object. If we plotted 10 elements together, then they would count as a single object. Using get_data() would return the coordinates for 10 elements, not just one. To rectify this, we plotted each of them individually, so they count as individual objects.
Disable the Cursor Widget
A common question that goes around, is “how to disable the Cursor widget”. So let’s take a look at that.
We have designed the below code in a way that if we press any key on the keyboard, it will disable our Cursor permanently. The first thing to do is call the disconnect_events() method on the Cursor. This removes all events associated with it, so it will stop moving.
However, it will still be left drawn on the Window. To resolve this, we need to clear() the plot entirely, and then redraw the data. And that’s all!
from matplotlib.widgets import Cursor
import numpy as np
import matplotlib.pyplot as plt

def disable(event):
    cursor.disconnect_events()
    ax.clear()
    for i in range(len(x)):
        ax.plot(x[i], y[i], 'o', picker=True, color="blue")
    fig.canvas.draw_idle()

fig, ax = plt.subplots(figsize=(8, 6))
x, y = 4*(np.random.rand(2, 100) - .5)

for i in range(len(x)):
    ax.plot(x[i], y[i], 'o', picker=True, color="blue")

cursor = Cursor(ax, useblit=True, color='red', linewidth=2)
fig.canvas.mpl_connect('key_press_event', disable)
plt.show()
This marks the end of the Matplotlib Cursor Widget Tutorial. Any suggestions or contributions for CodersLegacy are more than welcome. Questions regarding the tutorial content can be asked in the comments section below.