
In this Matplotlib Tutorial, we will explore how to create and use the TextBox Widget with the help of examples code and images.
Creating a TextBox Widget in Matplotlib
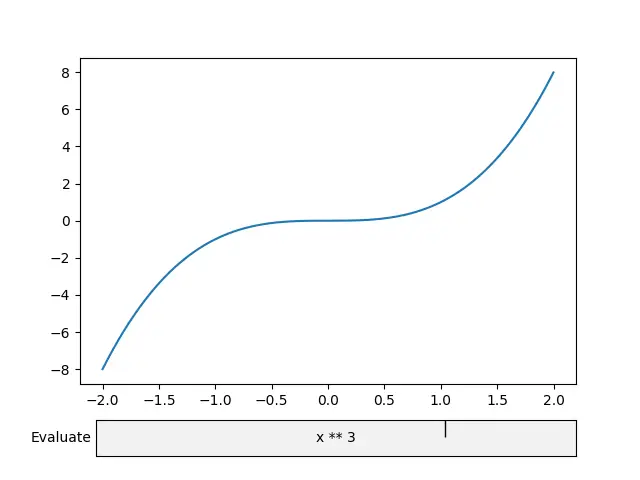
For our first example, we will take a look at some sample code from the official matplotlib documentation. This code is shown below. To sum it up briefly, it creates a simple textbox widget which takes an “expression” for a graph (like x^2).
This expression is evaluated by Python functions, which return the values that we require. We then plot these values onto our Matplotlib window to produce the appropriate graph.
import numpy as np
import matplotlib.pyplot as plt
from matplotlib.widgets import TextBox

fig, ax = plt.subplots()
fig.subplots_adjust(bottom=0.2)

x = np.arange(-2.0, 2.0, 0.001)
l, = ax.plot(x, np.zeros_like(x))


def submit(expression):
    # Calculate y-axis data and update plot
    ydata = eval(expression)
    l.set_ydata(ydata)

    # Rescale graph to fit new data
    ax.relim()
    ax.autoscale_view()

    # Draw changes to Plot
    plt.draw()


axbox = fig.add_axes([0.15, 0.05, 0.75, 0.075])
textbox = TextBox(axbox, "Evaluate", textalignment="center")
textbox.on_submit(submit)
textbox.set_val("x ** 2")  # Triggers the submit() function

plt.show()
Let us break this code down chunk by chunk and discuss how it works.
First we need to make our necessary imports (numpy for data generation, pyplot for plotting, and the TextBox widget). Next we create our simple Matplotlib figure and axes object. After this generate some x-axis data and then plot our graph (we plot an empty array of zeros for the y-axis for now).
import numpy as np
import matplotlib.pyplot as plt
from matplotlib.widgets import TextBox

fig, ax = plt.subplots()

x = np.arange(-2.0, 2.0, 0.001)
l, = ax.plot(x, np.zeros_like(x))
We leave the y-axis data blank for now, because it will be determined by the expression inside the textbox.
Our next step is to define the submit() function which is called whenever we press enter on the textbox (we will perform this binding in a later step).
The submit function will automatically receive the currently typed value inside the TextBox widget (after it has been bound to the widget). We will then call the eval() function on this value. eval() is a built in function in Python which takes a string expression and then returns the result. Then using the set_ydata() method, we update our graph with this “result”.
def submit(expression):
    # Calculate y-axis data and update plot
    ydata = eval(expression)
    l.set_ydata(ydata)

    # Rescale graph to fit new data
    ax.relim()
    ax.autoscale_view()

    # Draw changes to Plot
    plt.draw()
We also need to “rescale” our graph using two methods on the axes object. This is usually because the range of values is a bit different for each expression, and we want to adjust our graph axes accordingly. Don’t forget to update all these changes visually by calling plt.draw() (or an equivalent function).
We don’t actually have any space on our graph right now for the TextBox widget (because by default the plot takes up all the space). Hence, we need to adjust the position of the graph a bit to make some space.
fig.subplots_adjust(bottom=0.2)
The subplots_adjust() function does exactly that. We can modify the offsets for either the left, bottom, top and right (values range from 0 to 1).
Now we create our new axes object which takes a list with 4 parameters. The first is the x-offset, next is the y-offset, followed by the width and the height. This axes object is then used to create the textbox widget.
axbox = fig.add_axes([0.15, 0.05, 0.75, 0.075])
textbox = TextBox(axbox, "Evaluate", textalignment="center")
textbox.on_submit(submit)
textbox.set_val("x ** 2")  # Triggers the submit() function
In this code snippet you can also observe how we “bind” our widget to the submit() function. All we need to do is pass the name of the submit function to the on_submit() method in our textbox widget.
Compiling together all of this code and running it produces the following output. (We modified the expression in the textbox slightly from x**2 to x**3)
TextBox Widget – Example#2
In this example we will be making use of two widgets in matplotlib. The TextBox widget, along with a Button Widget. We will be using the Button widget to replace some of the functionality of the TextBox widget.
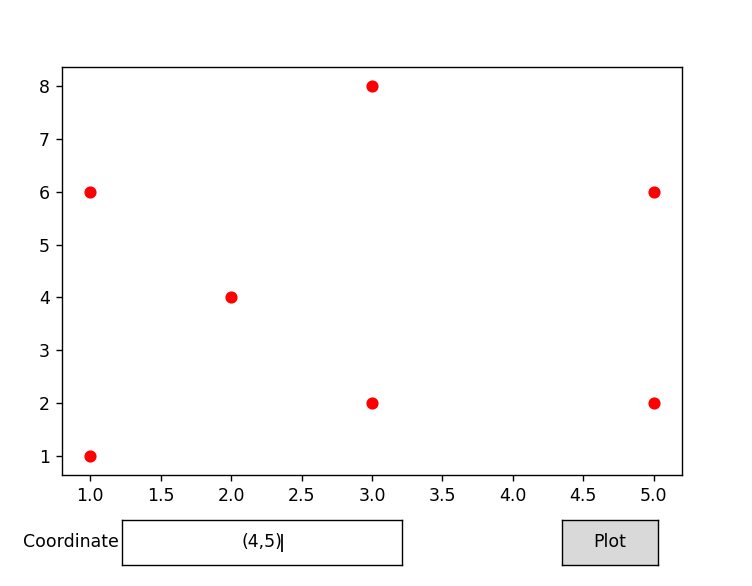
Our goal here is simple. We will start off with an empty scatter plot. We will then add new coordinates/dots using the TextBox widget. The coordinates will be entered in a specific format, which we then parse and plot. (You can do this without the Button widget, but we just want to show you an example with multiple widgets)
Here is our first code snippet. We have created a simple graph here, left some space for a button and textbox widget at the bottom (using the subplots_adjust function), and initialized two empty lists, x and y which store the values for our plot. These two are empty by default.
import numpy as np
import matplotlib.pyplot as plt
from matplotlib.widgets import TextBox, Button

fig, ax = plt.subplots()
fig.subplots_adjust(bottom=0.2)

x = []
y = []
l, = ax.plot(x, y, marker = "o", ls = '', color = "red")
plt.show()
We have passed a few extra parameters to our plot() function. This is used to convert it from a line graph to a scatter plot. This was done by turning the “line style” (ls) to null, and setting the “marker” to a round dot.
Next, we will actually both widgets to our Graphs. Remember to create two separate axes (one for each widget), and place them properly. We have not currently binded any widget to a function, nor have we defined such a function.
import numpy as np
import matplotlib.pyplot as plt
from matplotlib.widgets import TextBox, Button


fig, ax = plt.subplots()
fig.subplots_adjust(bottom=0.2)

x = []
y = []
l, = ax.plot(x, y, color = "red")

axbox = fig.add_axes([0.2, 0.05, 0.35, 0.075])
textbox = TextBox(axbox, "Coordinate", textalignment="center")

buttonax = fig.add_axes([0.75, 0.05, 0.12, 0.075])
button = Button(buttonax, 'Plot')

plt.show()
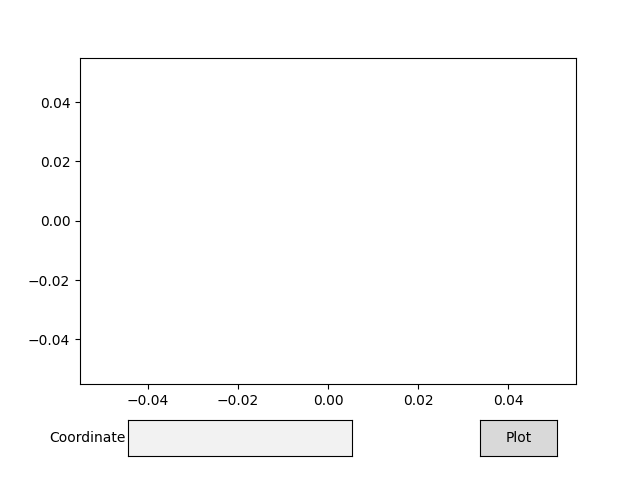
This is our current output. We have the visual look, now it’s time to implement the functions involved. Whenever we click the “plot” button, whatever is in the Coordinates textbox should get plotted. That is our base game here.
Here is a function that will trigger when we click the button. It acquires the currently entered text in the TextBox Widget using the text attribute. Next, it removes the first and last values (because they are brackets), and then it splits it along the comma, returning a list of 2 values (x and y).
def plot(event):
    global x, y
    coords = textbox.text[1:-1].split(',')
    x.append(int(coords[0].strip()))
    y.append(int(coords[1].strip()))
    l.set_data(x, y)
    textbox.set_val('')

    ax.relim()
    ax.autoscale_view()
    plt.draw()
We then convert these two strings to integers and append them in the x and y arrays. We need to execute strip() on them first, just incase there are some extra whitespaces added in (which cause problems when converting to integer).
After this we update the graph using set_data(), set the current value of the textbox back to null, rescale the graph and then redraw it to show new changes.
Here is the complete code, plus some sample output.
This marks the end of the Matplotlib TextBox Widget Tutorial. Any suggestions or contributions for CodersLegacy are more than welcome. Questions regarding the tutorial content can be asked in the comments section below.