
Matplotlib is a popular plotting library that can be used to create various types of graphs and charts in Python. PyQt6 is a GUI toolkit for Python that can be used to create desktop applications. In this tutorial, we will learn how to embed Matplotlib graphs into a PyQt6 application.
How to embed a Matplotlib Graph into PyQt6?
We will present a step-wise breakdown of all the steps required to display matplotlib graphs in a PyQt6 application.
1. Prerequisites
Before we begin, make sure that you have installed the following packages:
pip install PyQt6
pip install matplotlib
Once these two have been installed successfully, proceed with the tutorial.
2. Import the Required Libraries
First import the required submodules from the matplotlib library. Matplotlib has several “backends”, which can contain Classes which can be used to integrate it within other libraries, such as PyQt6 and Tkinter.
from matplotlib.backends.backend_qtagg import FigureCanvasQTAgg as FigureCanvas
from matplotlib.figure import Figure
3. Create a Matplotlib Figure
To create a Matplotlib graph, you need to first create a Figure object. You can do this by calling the Figure() constructor:
fig = Figure()
The Figure object is the top-level container for all the plot elements, including the axis, labels, legends, etc.
4. Add a Plot to the Figure
Once you have created a Figure object, you can add a plot to it using the add_subplot() method:
ax = fig.add_subplot()
The add_subplot() method creates an Axes object and adds it to the Figure. The axes object is where all the plotting methods and related functionality is located.
5. Plot the Data
Now that we have an Axes object, we can plot the data using Matplotlib’s plotting functions. For example, to plot a simple line graph, we can use the plot() method:
x = [1, 2, 3, 4, 5]
y = [1, 4, 9, 16, 25]
ax.plot(x, y)
This will plot a line graph with x values on the x-axis and y values on the y-axis. To actually display this graph, we need to add it into the PyQt6 window.
6. Create a Canvas
To embed the Matplotlib graph into a PyQt6 application, we need to create a FigureCanvas object. It takes a single parameter, which is the figure object you wish to display (remember that the figure object contains the axes(es) object).
canvas = FigureCanvas(fig)
The FigureCanvas object is a PyQt6 widget that can be added to a layout or a window. You can think of this as intermediatory between matplotlib and pyqt6. FigureCanvas is an object which can interact with both matplotlib and pyqt6.
7. Create a PyQt6 Window
Now that we have a FigureCanvas object, we can create a PyQt6 window and add the canvas to it. Here’s an example of how to create a basic PyQt6 window:
from PyQt6.QtWidgets import QWidget, QApplication

class MyWindow(QWidget):
    def __init__(self):
        super().__init__()
        self.setGeometry(100, 100, 640, 480) # set window geometry
        canvas = FigureCanvas(fig) # create canvas
        self.layout().addWidget(canvas) # add canvas to layout
In this example, we create a MyWindow class that inherits from the QWidget class. We set the window geometry using the setGeometry() method and create a FigureCanvas object. We then add the FigureCanvas object to the layout using the addWidget() method.
Here is the full code:
from PyQt6.QtWidgets import QWidget, QApplication, QVBoxLayout
from matplotlib.backends.backend_qtagg import FigureCanvasQTAgg as FigureCanvas
from matplotlib.figure import Figure
import sys

class MyWindow(QWidget):
    def __init__(self):
        super().__init__()
        layout = QVBoxLayout()
        self.setLayout(layout)

        canvas = FigureCanvas(fig) # create canvas
        layout.addWidget(canvas)   # add canvas to layout

fig = Figure()
ax = fig.add_subplot()

x = [1, 2, 3, 4, 5]
y = [1, 4, 9, 16, 25]
ax.plot(x, y)

app = QApplication(sys.argv)
window = MyWindow()
window.show()
sys.exit(app.exec())
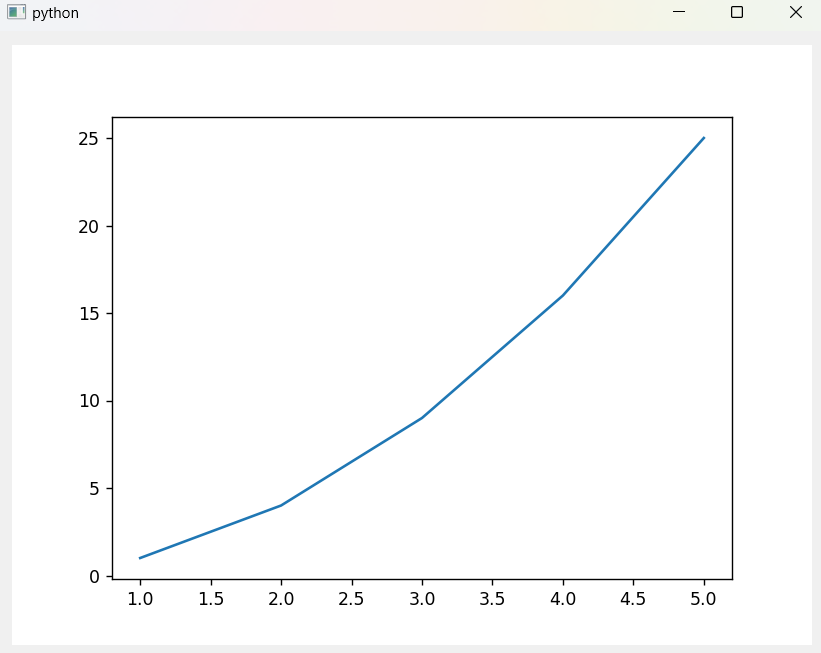
Here is the output of the above code:
Adding a Matplotlib Navigation Toolbar in PyQt6
To add the standard matplotlib navigation toolbar, we need to make another import.
from matplotlib.backends.backend_qtagg import NavigationToolbar2QT as NavigationToolbar
After this, all we need to do is create the toolbar widget using this class, and then add it to the layout, just like we did earlier with the canvas. Just remember to pass in the canvas to which it is to be attached to, as the first parameter.
Here is the complete code with all the necessary changes.
from PyQt6.QtWidgets import QWidget, QApplication, QVBoxLayout
from matplotlib.backends.backend_qtagg import FigureCanvasQTAgg as FigureCanvas
from matplotlib.backends.backend_qtagg import NavigationToolbar2QT as NavigationToolbar
from matplotlib.figure import Figure
import sys

class MyWindow(QWidget):
    def __init__(self):
        super().__init__()
        layout = QVBoxLayout()
        self.setLayout(layout)

        canvas = FigureCanvas(fig) # create canvas
        layout.addWidget(canvas)   # add canvas to layout

        # Create and add toolbar
        toolbar = NavigationToolbar(canvas, self)
        layout.addWidget(toolbar)

fig = Figure()
ax = fig.add_subplot()

x = [1, 2, 3, 4, 5]
y = [1, 4, 9, 16, 25]
ax.plot(x, y)

app = QApplication(sys.argv)
window = MyWindow()
window.show()
sys.exit(app.exec())
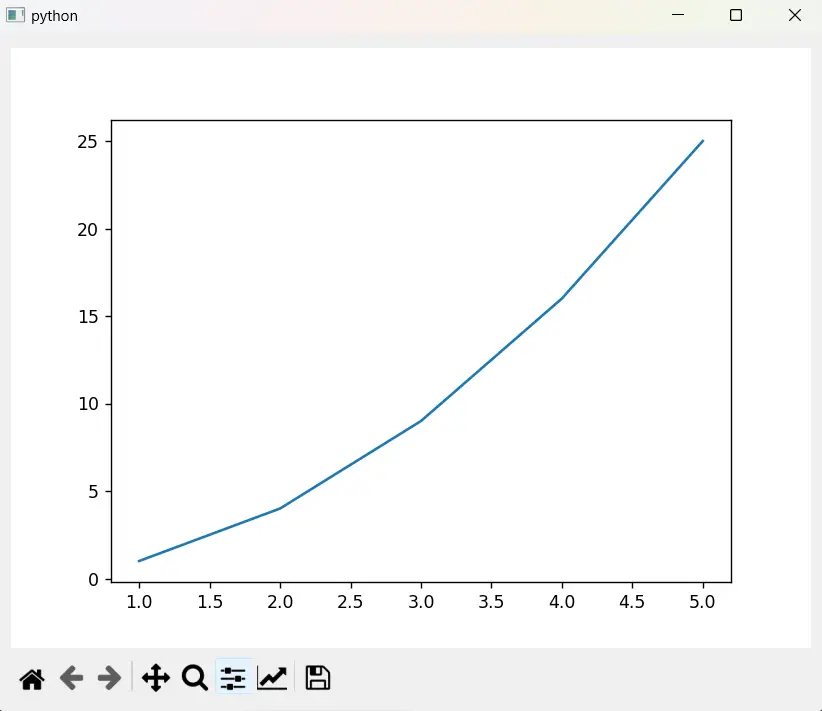
Here is the output. Can you see the little navigation bar at the bottom of the window? You can use it to zoom, move, and configure various settings for your plot. There is even a save button!
This marks the end of the How to Embed Matplotlib Graphs into a PyQt6 Application Tutorial. Any suggestions or contributions for CodersLegacy are more than welcome. Questions regarding the tutorial content can be asked in the comments section below.
TypeError: addWidget(self, a0: Optional[QWidget], stretch: int = 0, alignment: Qt.AlignmentFlag = Qt.Alignment()): argument 1 has unexpected type ‘FigureCanvasQTAgg’
I always get this same error