
Matplotlib is a famous Plotting Library in Python, while Tkinter is a popular GUI library in Python. While working with Tkinter, we might wonder how we can integrate (also known as “embed”) Matplotlib graphs into our Tkinter applications. Luckily for us, there is a really easy way of doing so, as Matplotlib has provided built-in functionality to allow it to be integrated with Tkinter.
In this tutorial we will be discussing these “features” and showing you how to use the full range of Matplotlib’s plotting features inside a Tkinter application.
Plotting Matplotlib Graphs in Tkinter
There are two Classes that Matplotlib provides us that allow it to be integrated with Tkinter. The first one, called FigureCanvasTkAgg is a special type of “canvas” object which can be used by Tkinter in place of its regular Canvas widget. FigureCanvasTkAgg is compatible with both Tkinter commands and Matplotlib plotting functions.
The second Class is navigationtoolbar2tk which integrates the Matplotlib Navigation Toolbar into Tkinter. We will discuss this Class further at a later point in this tutorial.
First lets explore how to setup FigureCanvasTkAgg and display a simple graph in a Tkinter application using matplotlib.
Embed Matplotlib Canvas in Tkinter
Lets start off with a basic Tkinter application with a single Tkinter widget.
import matplotlib.pyplot as plt
import tkinter as tk

# Initialize Tkinter
root = tk.Tk()

# Tkinter Application
frame = tk.Frame(root)
label = tk.Label(text = "Matplotlib + Tkinter!")
label.config(font=("Courier", 32))
label.pack()
frame.pack()

root.mainloop()
Now lets begin integrating the Matplotlib code into this. Most importantly, we need to make a few new imports, and create the Matplotlib Figure and Axis object.
The actual plotting will take place on the Matplotlib Figure and Axis (like it always does). The FigureCanvasTkAgg merely displays the plot in Tkinter.
Here we have made two new imports. One for the FigureCanvasTkAgg, and one for Numpy (since we need it for generating data).
import matplotlib.pyplot as plt
from matplotlib.backends.backend_tkagg import (
     FigureCanvasTkAgg, NavigationToolbar2Tk)
import tkinter as tk
import numpy as np
Next we initialize the Figure and Axis.
# Initialize Tkinter and Matplotlib Figure
root = tk.Tk()
fig, ax = plt.subplots()
Now onto the main subject of todays tutorial. Here we need to create our canvas object first. It takes two parameters, the first being the Matplotlib figure we created in the last step, and the Tkinter root object (which represents our Tkinter application).
# Create Canvas
canvas = FigureCanvasTkAgg(fig, master=root)
canvas.get_tk_widget().pack(side=tk.TOP, fill=tk.BOTH, expand=1)
Whenever we want to perform a Tkinter-based operation on the Canvas, we need to call get_tk_widget() first. We needed to do this in the above code to properly pack it in. We also enabled the expand and fill options, as it is good for a Canvas to be able to resize itself (generally).
Finally, we will plot the data and call the draw() function on the canvas object. If you do not call the draw() function, the changes will not update on the Canvas.
# Plot data on Matplotlib Figure
t = np.arange(0, 2*np.pi, .01)
ax.plot(t, np.sin(t))
canvas.draw()
Here is the full code.
import matplotlib.pyplot as plt
from matplotlib.backends.backend_tkagg import (
FigureCanvasTkAgg)
import tkinter as tk
import numpy as np
# Initialize Tkinter and Matplotlib Figure
root = tk.Tk()
fig, ax = plt.subplots()
# Tkinter Application
frame = tk.Frame(root)
label = tk.Label(text = "Matplotlib + Tkinter!")
label.config(font=("Courier", 32))
label.pack()
frame.pack()
# Create Canvas
canvas = FigureCanvasTkAgg(fig, master=root)
canvas.get_tk_widget().pack(side=tk.TOP, fill=tk.BOTH, expand=1)
# Plot data on Matplotlib Figure
t = np.arange(0, 2*np.pi, .01)
ax.plot(t, np.sin(t))
canvas.draw()
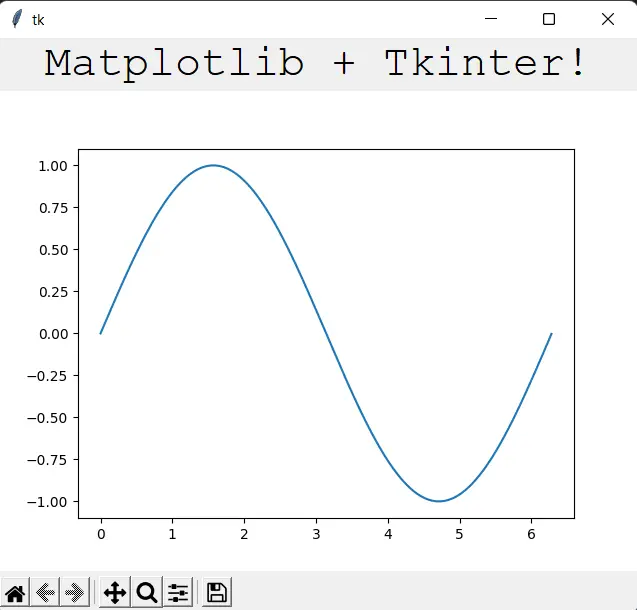
root.mainloop()
And here is our output.

Embed Navigation Toolbar in Tkinter
There is still one thing missing in our Matplotlib/Tkinter Application. We are missing the navigational toolbar that appears by default in all Matplotlib Figure windows near the bottom.
Time to make a new import, and add this feature to our graph from earlier!
from matplotlib.backends.backend_tkagg import (
     FigureCanvasTkAgg, NavigationToolbar2Tk)
Next we just have to create our toolbar in the following manner.
# Create Toolbar
toolbar = NavigationToolbar2Tk(canvas, root, pack_toolbar=False)
toolbar.update()
toolbar.pack(side=tk.BOTTOM, fill=tk.X)
Don’t forget to pack the toolbar at the bottom, otherwise it will look out of place. Allowing it to expand horizontally is also a good UI choice.
And that’s it! We are done.
This marks the end of the Embed Matplotlib Graphs in Tkinter Tutorial. Any suggestions or contributions for CodersLegacy are more than welcome. Questions regarding the tutorial content can be asked in the comments section below.
wow, I needed this so bad and I am impressed. Quick and straight to the point. Thanks.
This is good thanks. But there is one problem and I can’t fond the answer.
The program exits with code =1. Normally it should exit with code =0 .
Googling for an answer, I got ….
exit(1) means there was some issue / error / problem and that is why the program is exiting. This is not Python specific and is pretty common. A non-zero exit code is treated as an abnormal exit, and at times, the error code indicates what the problem was. A zero error code means a successful exi