
Matplotlib is a versatile and widely-used library for data visualization in Python. While it excels at creating static plots and charts, it’s also capable of producing interactive visualizations. In this article, we are going to explore how to create such interactive plots in Matplotlib that allow users to actually interact with the graph, and drawn elements using the mouse cursor.
Let’s begin!
What are Interactive Plots?
Interactive Plots are special types of graphs which allow the user to interact with them, and making changes to the graph in real time. This is in contrast to static graphs, which only render once, and do not change over the duration of their lifetime.
There are two ways that interactive plots are typically created in matplotlib. The first method involves the use of “widgets” like buttons and checkboxes which can control and modify the graph.
The second method involves the use of “events” and the mouse pointer. The user performs an action using the mouse, like a click, which triggers an event, which in turn triggers a function which runs whatever code we want to. We can also incorporate complex actions, such as “mouse drag” and “scrolling” into our matplotlib applications with this method.
Both methods are equally effective, each with their own pros and cons. However, we will be focusing on the second method in this tutorial.
What is an Artist in Matplotlib?
This is a term that many who have been using matplotlib, likely do not know. This term will be used frequently through this tutorial, so it is important that we clarify its meaning right now.
In Matplotlib, an “artist” refers to a fundamental graphical object or entity that can be drawn on a canvas or axes, contributing to the visual representation of a plot or chart. These artists encompass a wide range of graphical elements, including shapes (e.g., rectangles, circles), lines, text, images, and more.
In simple words, an artist is anything that is drawn to the screen. A matplotlib shape, graph, even text.
“Selecting” an Artist using Mouse Pointer
In this section, we will cover how to use the mouse pointer to click on an artist, and retrieve its details (such as position, type, color, etc.). The technique that we will explore is a general approach, and will work on any, and all types of artists in matplotlib.
We will begin by introducing the code snippet-by-snippet, along with the appropriate explanations.
import matplotlib.pyplot as plt
from matplotlib.patches import Rectangle, Circle
We have imported the plotting module in matplotlib, and also some “shapes” like a Rectangle and Circle.
Next, we create the matplotlib figure and axes object. The figure represents the window, whereas the axes represents the graph region where the plotting is done.
# Create a figure and axis
fig, ax = plt.subplots()
Now we create some objects which we will be drawing to our matplotlib window. The first parameter in both of these classes controls the initial position, whereas the following parameters control the dimensions of the object, and other aspects like color.
# Draw some shapes for demonstration
rect = Rectangle((0.1, 0.1), 0.3, 0.4, fc="blue", picker=True)
circle = Circle((0.7, 0.7), 0.1, fc="red", picker=True)
The important thing to notice here is the picker=True parameter. This parameter enables the interactive feature that allows you to click on and select the drawn artists on the plot. This is normally kept off by default for performance reasons, as it is not needed in static graphs. Once this is turned on, matplotlib will begin tracking actions related to these objects (e.g. mouse clicks), and generate a pick event when an action occurs.
The next step is to add the created shapes to the plot:
# Add these shapes to the graph
ax.add_patch(rect)
ax.add_patch(circle)
This step is going to vary a bit depending on the type of object you are plotting. For example, scatter() would be used for a scatter plot, bar() would be used for a bar graph, etc.
Defining the onClick() Function
Before we proceed any further, we need to actually define a function which will execute when we interact (click) on any of our objects.
Here is our code for such a function, which performs the simple task of retrieving the artist behind the pick event (using .artist attribute), and prints out the relevant details based on which object it was (which we figure out using the isinstance method).
def onClick(event):
    artist = event.artist
    if isinstance(artist, Rectangle):
        print("Selected Artist Type: Rectangle")
        print(f"Artist Details: {artist.get_bbox()}")
    elif isinstance(artist, Circle):
        print("Selected Artist Type: Circle")
        center = artist.center
        radius = artist.radius
        print(f"Center: ({center[0]}, {center[1]}), Radius: {radius}")
In case you are wondering where the event parameter came from, this is automatically passed in by matplotlib when you connect a function to the pick event.
We will now connect this function to the pick event, and call the show() method to display our graph.
# Connect the pick event to the onClick function
fig.canvas.mpl_connect('pick_event', onClick)
plt.show()
With the pick event, we can trigger the onClick function by using any kind of mouse click (left/right/scroll).
Here is our output:
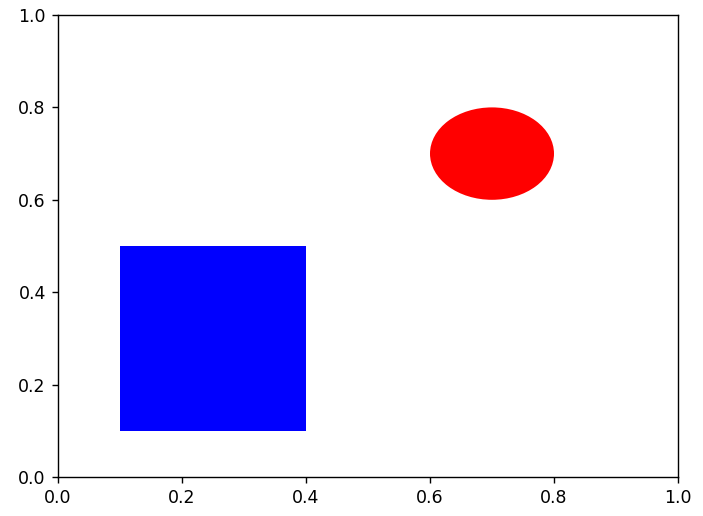
Clicking on the rectangle object here gives us the following output:
Selected Artist Type: Rectangle
Artist Details: Bbox(x0=0.1, y0=0.1, x1=0.4, y1=0.5)
Similarly, clicking on the circle object gives us the followiing:
Selected Artist Type: Circle
Center: (0.7, 0.7), Radius: 0.1
Pretty cool, right?
Interactive Plots where you can modify Artists
In this section, we will extend the previous example, and show you how to modify artists upon selecting them. Our goal in this section will be to create a system, where we have multiple objects in a matplotlib window, and can “select” one of them by clicking on it, upon which it will be highlighted (by changing the color of the object).
The base concept and code remains the same, we just need to change what we put into the onClick() function (or any function connected to the pick event). To simplify this example a bit, we will be using only rectangles.
Here is the base code, without any of extra interactivity stuff:
import matplotlib.pyplot as plt
from matplotlib.patches import Rectangle, Circle

# Create a figure and axis
fig, ax = plt.subplots()

# Draw some shapes for demonstration
rect1 = Rectangle((0.1, 0.1), 0.3, 0.4, fc="blue", picker=True)
rect2 = Rectangle((0.4, 0.6), 0.2, 0.3, fc="blue", picker=True)
rect3 = Rectangle((0.8, 0.2), 0.1, 0.3, fc="blue", picker=True)

# Add these shapes to the graph
ax.add_patch(rect1)
ax.add_patch(rect2)
ax.add_patch(rect3)

plt.show()
Next, we will define the onClick function.
def onClick(event):
    artist = event.artist
    if isinstance(artist, Rectangle):
        artist.set_facecolor('yellow')
    plt.draw()
There are two main lines of code here. Line 4, where we call the set_facecolor method on the artist object, and Line 5, where we call the plt.draw() method to update the matplotlib graph with our new changes.
We can then connect our onClick function, to the pick event, and display the graph.
fig.canvas.mpl_connect('pick_event', onClick)
plt.show()
However, this code results in a problem which is illustrated by the following image of our current output (after all objects have been clicked once):
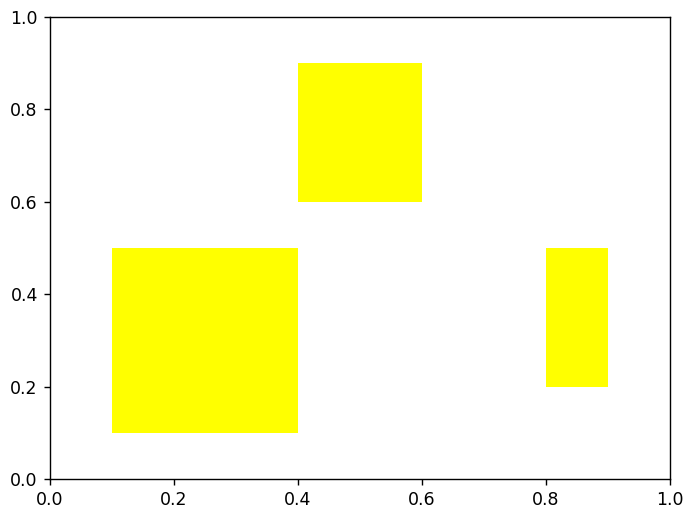
Managing de-selection
The current issue with the onClick function is that when we click on two objects consecutively, both remain highlighted. In an ideal scenario, clicking on, for example, rectangle-1 should highlight it, and when we subsequently click on rectangle-2, it should become highlighted while rectangle-1 becomes unhighlighted simultaneously.
What we need to do now, is setup a system which keeps tracks of the currently selected object (which is none by default). For this, we can create a global variable (or a variable creating using self if you are using OOP) called current_artist.
current_artist = None
We will now modify our onClick function to make use of this variable to add the concept of “de-selection” into our system. In simpler words, this will reset the color of the previously-selected object, before selecting a new one.
def onClick(event):
    global current_artist
    artist = event.artist

    if isinstance(artist, Rectangle):
        if current_artist:
            current_artist.set_facecolor("blue")
        current_artist = artist
        artist.set_facecolor('yellow')
    plt.draw()
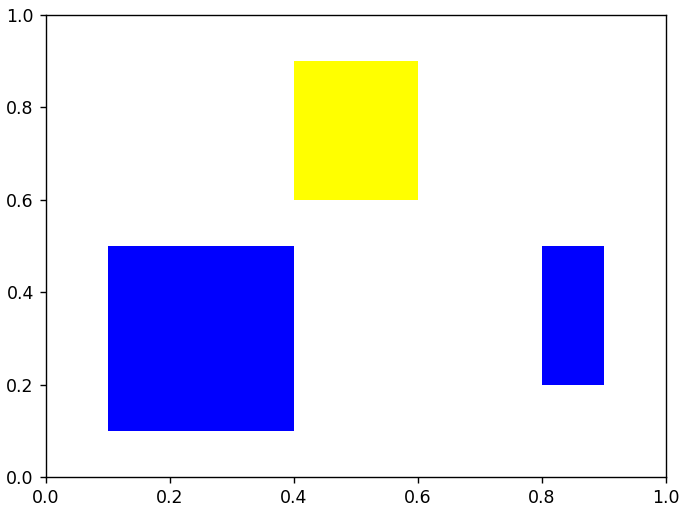
Now our code will work flawlessly, and properly highlight, and un-highlight objects as we interact with the graphs.
This marks the end of the Interactive Plots in Matplotlib Tutorial. Any suggestions or contributions for Coderslegacy are more than welcome. Questions regarding the tutorial content can be asked in the comments section below.
1 thought on “Interactive Plots in Matplotlib: Mouse-Driven Selection of Artists”