
In this tutorial we will discuss how to change the default fonts on the Matplotlib Graphs and Charts. While the matplotlib default fonts are suitable for most scenarios, changing them to custom fonts often becomes a necessity.
We will discuss two different techniques that you can use for changing fonts in matplotlib.
Method# 1 – Changing Fonts Globally
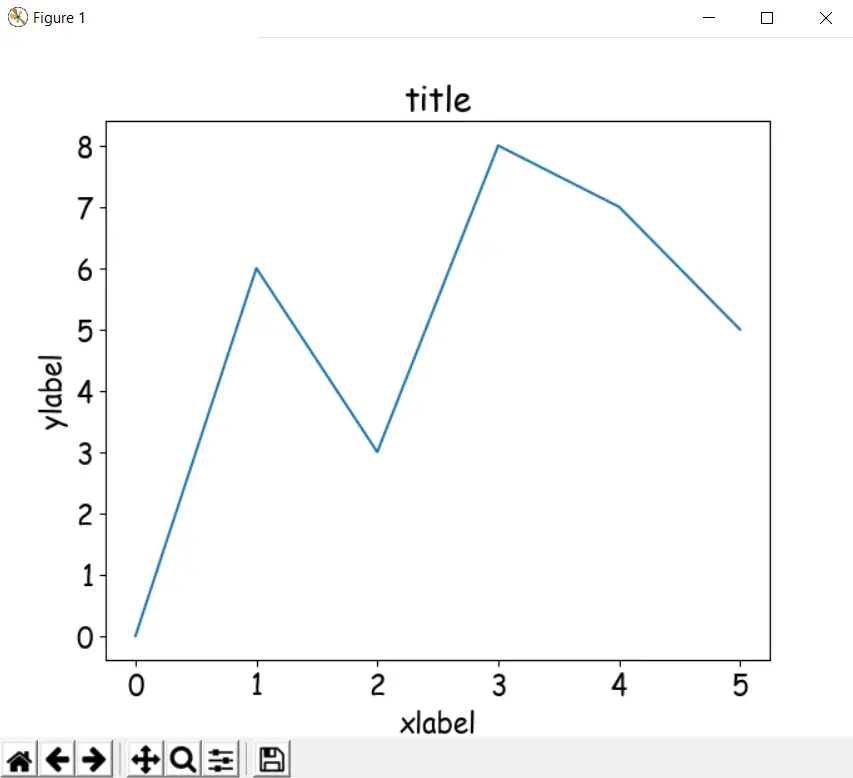
The first method of changing fonts involves using the rc module in matplotlib. If we pass the correct parameters in the rc() function, we can change the fonts globally. As you will see in the output image, even the text for the ticks is changed using this method.
import matplotlib.pyplot as plt
from matplotlib import rc

x = [0, 1, 2, 3, 4, 5]
y = [0, 6, 3, 8, 7, 5]

rc('font',**{'family':'Comic Sans MS', 'size': 16})

plt.title('title')
plt.xlabel('xlabel')
plt.ylabel('ylabel')

plt.plot(x, y)
plt.show()
The output from running the above code:
Method# 2
This method does not require you to make any additional imports. Another difference between this method and the previous one, is that this method does not change the font globally. If you want to change some text, such as the xlabel or ylabel, you must the pass the dictionary containing the font attributes as a parameter in these function.
This gives you more control over your application, at the expense of a little extra code.
import matplotlib.pyplot as plt

x = [0, 1, 2, 3, 4, 5]
y = [0, 6, 3, 8, 7, 5]

myfont = {'fontname': 'Comic Sans MS', 'fontsize': 16}

plt.title('title', **myfont)
plt.xlabel('xlabel', **myfont)
plt.ylabel('ylabel', **myfont)

plt.plot(x, y)
plt.show()
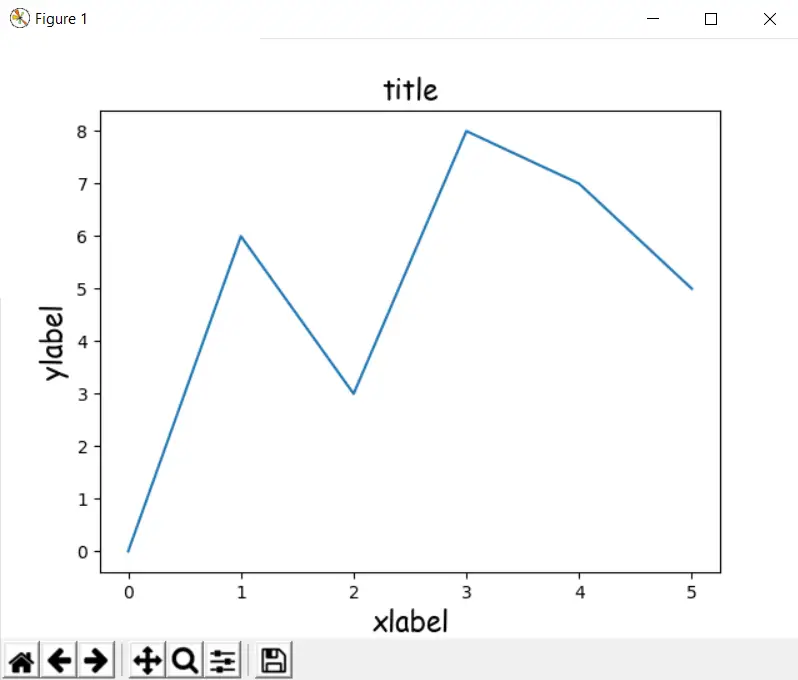
This produces the same output as the first method, with one small difference. The text on the ticks (the x-axis and y-axis) are still using the default font.
Custom Fonts
Matplotlib by default only has a few different fonts available to us. If you try using a font like “Helvetica” for example, it will likely not be found and matplotlib will revert back to the default font.
If you want to learn how to add custom fonts in matplotlib, follow the link to our tutorial on this subject.
This marks the end of the Changing fonts in Matplotlib Tutorial. Any suggestions or contributions for CodersLegacy are more than welcome. Questions regarding the tutorial content can be asked in the comments section below.