Matplotlib is a powerful graphing library in Python which comprises of various modules, each with bringing a unique set of features to the table. One such module is the Animation module, which we will be focusing on in this Matplotlib Tutorial.
Animation in Matplotlib
The animation module consists of several different Classes which we can use to animate graphs and plots. We have two main Classes, ArtistAnimation and FuncAnimation. Generally FuncAnimation is used for most animation, so we will be using it throughout this tutorial.
import matplotlib.pyplot as plt
from matplotlib.animation import FuncAnimation
Now let’s create our very first animated plot in matplotlib.
Animation in matplotlib is based around the concept of calling a function over and over again with fixed intervals. This function “updates” the plot with a minor change or addition. Continuously calling this function over short intervals (typically 100ms) gives it a very fluid and animated feel.
The FuncAnimation class takes 4 important parameters.
- The matplotlib figure, which we create with either
figure()orsubplots(). - The function which should be called for animating the graph.
- An integer that defines the interval between Function Calls.
- The number of “frames”. This defines how many time the function will be called in total. If we leave this to its default value, it will be infinite.
Animating a Line Graph
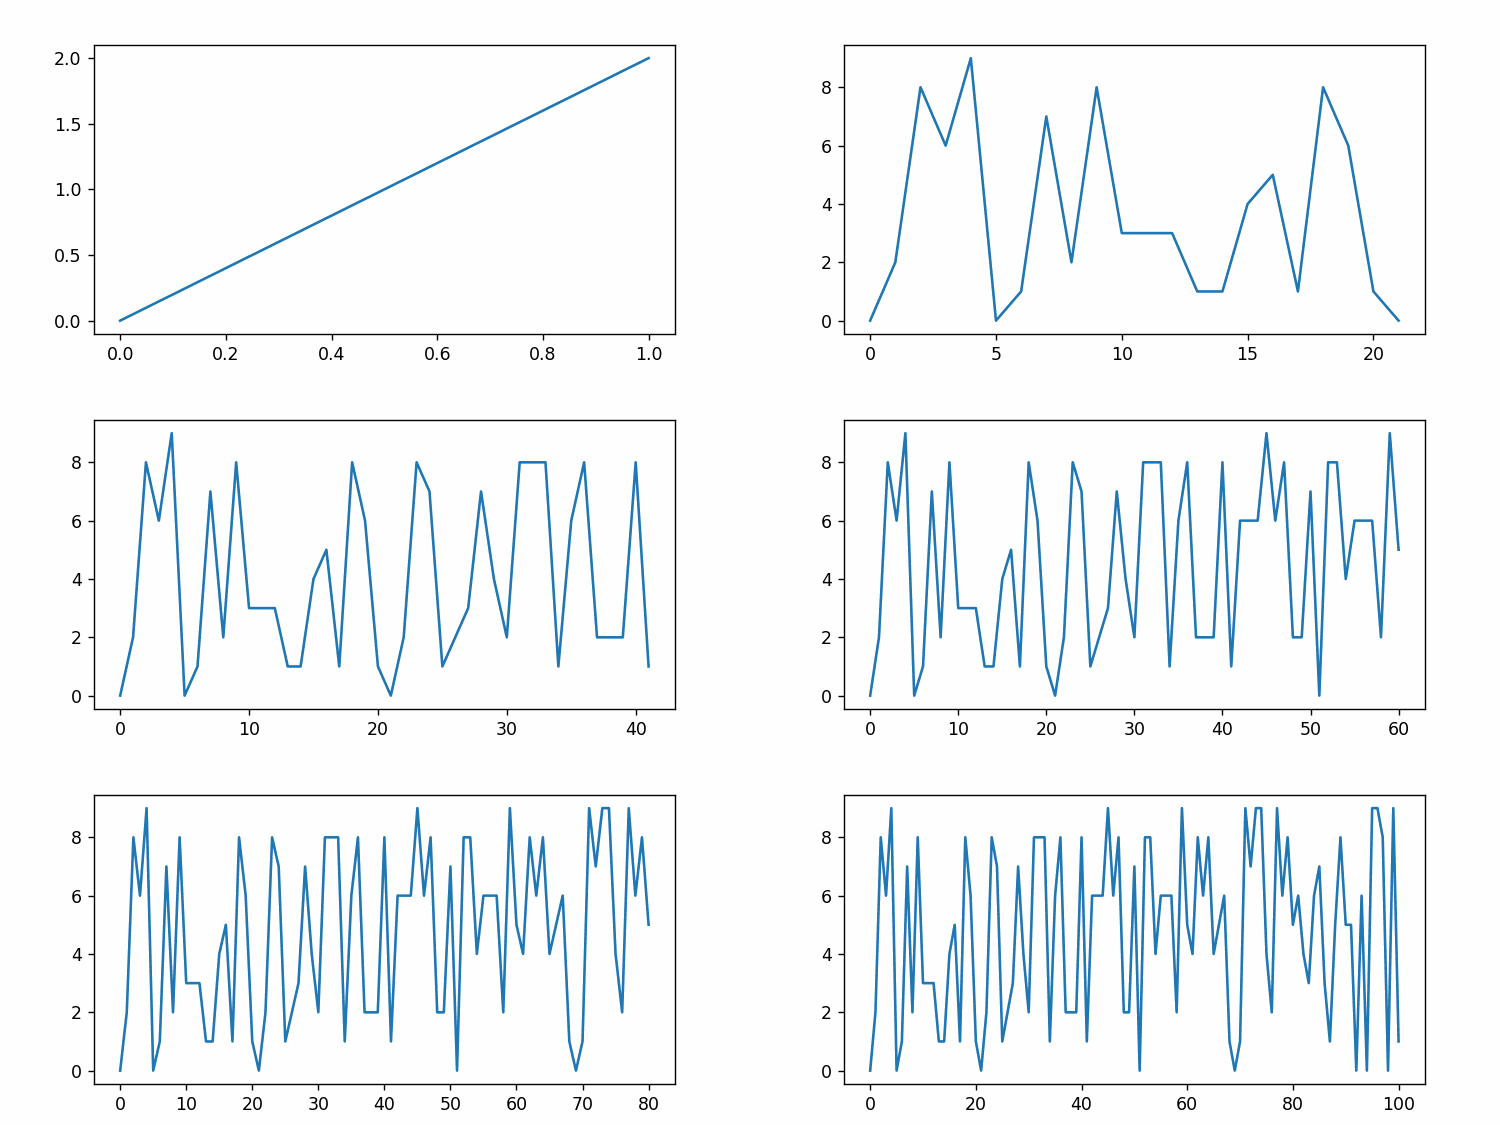
Below is some code which creates a simple line graph in Matplotlib. The line graph starts out with no values, but with our update() function which FuncAnimation calls every 100ms, a new point is added into our graph every 100ms.
import matplotlib.pyplot as plt
from matplotlib.animation import FuncAnimation
from random import randrange

fig = plt.figure(figsize=(6, 3))
x = [0]
y = [0]

ln, = plt.plot(x, y, '-')

def update(frame):
    x.append(frame+1)
    y.append(randrange(0, 10))

    ln.set_data(x, y)
    fig.gca().relim()   # redefines the axis for new data
    fig.gca().autoscale_view()  # adjusts view to fit all data
    return ln,

animation = FuncAnimation(fig, update, interval=100)
plt.show()
Every 100ms, we are calling the update function which also gets passed a “frame” number. This defines its sequence in the animation (like the 10th frame or the 26th frame). The update function will add a random new point ranging from 0 to 10 to our graph. We use set_data() on the return object of plt.plot() to update the graph with the new data.
Here is a gif of the output:

This kind of animation is particularly useful in real-time plotting. When plotting live data, there is no limit to how much there might be. For this reason we cannot give the axis a fixed size, and need to resize and rescale it automatically as shown earlier.
Animated Bar Graphs in Matplotlib
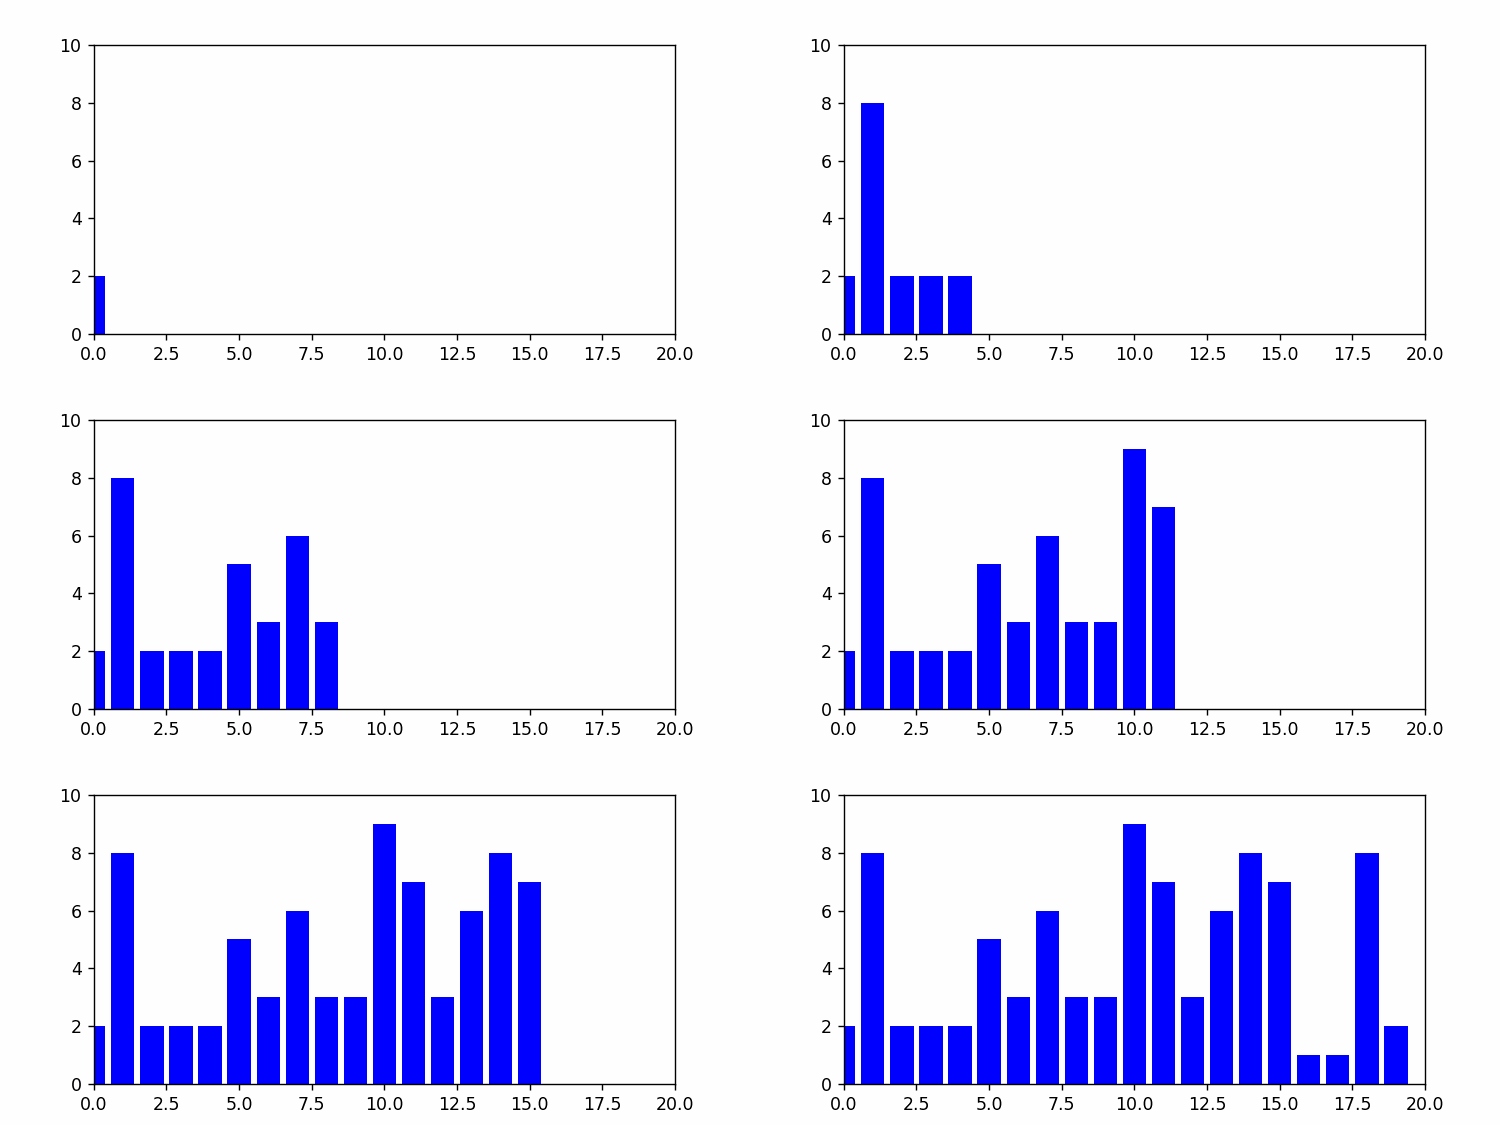
Let’s take a look at another example with an animated Bar graph in Matplotlib. While most plots can be updated using the set_data() function on their return object, Bar graphs are a bit different.
For Bar graphs we take a different approach where we plot all the bars at zero height initially, and then update each bar individually using the set_height() function. Remember that plt.bar() returns a collection of “bars”, which we can access as an iterable. (You can even iterate over it in a for loop)
import matplotlib.pyplot as plt
from matplotlib.animation import FuncAnimation
import numpy as np

fig, ax = plt.subplots(figsize=(6, 3))
x = range(20)
y = [0] * 20

bars = plt.bar(x, y, color="blue")
ax.axis([0, 20, 0, 10])

def update(frame):
    y[frame] = np.random.randint(0, 10)
    bars[frame].set_height(y[frame])

anim = FuncAnimation(fig, update, frames = 20, interval=100)
plt.show()

You might be wondering at this point, how we uploaded this output for you to see. We didn’t use any external tools, rather we had matplotlib save the animation in GIF/Video format for us. (Follow the link for the full tutorial)
You can quickly save an animation as a GIF with the save() method as shown below. (Include it right before plt.show())
anim.save("animation.gif")
Flower Animation in Matplotlib
Here is another interesting animation in Matplotlib using the polar() function. Don’t focus too much on the code, rather focus on the output and how the animation works.
import numpy as np
from matplotlib import pyplot as plt
import matplotlib.animation as animation
import matplotlib

fig, ax = plt.subplots(subplot_kw={'projection': 'polar'})

theta = np.linspace(0, 2*np.pi, 500)
r = 3 * np.sin(4 * theta)

line, = ax.plot([], [], 'r')
ax.set_rgrids((1, 2, 3))

def animate(i):
    line.set_data(theta[:i]+(r[:i]<0)*np.pi, np.abs(r[:i]))
    return line,

anim = animation.FuncAnimation(fig, animate, frames=500, interval=10, repeat=False)
plt.show()
Notice how we use repeat=False in the above code. This prevents the animation from looping.
You can try to save this in gif format, but it will be quite slow and the resulting file size will also be quite large. GIFs are only suitable for short animations with a smaller number of frames. Instead we use Videos for more complex animations.
Saving animations in video format is alot trickier and for most people it will require some extra setup due to a dependency that matplotlib has. For this reason we have a separate tutorial which explains how to save animations in video format in matplotlib.
This marks the end of the Matplotlib Animation Tutorial in Python. Any suggestions or contributions for CodersLegacy are more than welcome. Questions regarding the tutorial content can be asked in the comments section below.
