
In this Tutorial, we will be discussing two important Python Libraries, Shapely and Matplotlib. Or more specifically, we will be discussing how to plot Polygons created by Shapely, inside our Matplotlib Window.
Creating a Shapely Polygon
Before we begin plotting Polygons, we need to actually create one first. This can be done by importing the Polygon Class from the shapely module. Make sure you actually have shapely installed before running this command though.
from shapely.geometry import Polygon

poly = Polygon([(20, 20), (200, 20), (200, 180), (20, 180)])
You might also be in a situation, where you have all the x-axis coordinates in one list, and the y-coordinates in another list. So how do we create a Polygon in such a case?
x = [ 20, 200, 200, 20 ]
y = [ 20, 20, 180, 180 ]
poly = Polygon(zip(x, y))
What we did here, was use the zip() function, which combines both the lists in the format that we want (coordinate pairs). Try printing this out for yourself, and you will notice that it is the exact same thing as before.
A zip object is actually an iterable. Printing it will not show you its contents. To view the contents normally, you need to unpack it using the * operator as shown below.
print(*zip(x, y))
Plotting Shapely Polygons in Matplotlib
On to the main point of this tutorial. Now that we know how to create Polygons, lets plot them using Matplotlib.
We cannot plot a Polygon directly, rather we need to acquire its coordinate pairs, which we can then pass to Matplotlib. To plot simple polygons (with no interiors), we can retrieve the coordinates from the exterior.xy attribute belonging to our Polygon.
This returns to use a list of x and y coordinates, which we can then pass into our ax.plot() function.
import matplotlib.pyplot as plt
from shapely.geometry import Polygon
fig, ax = plt.subplots()
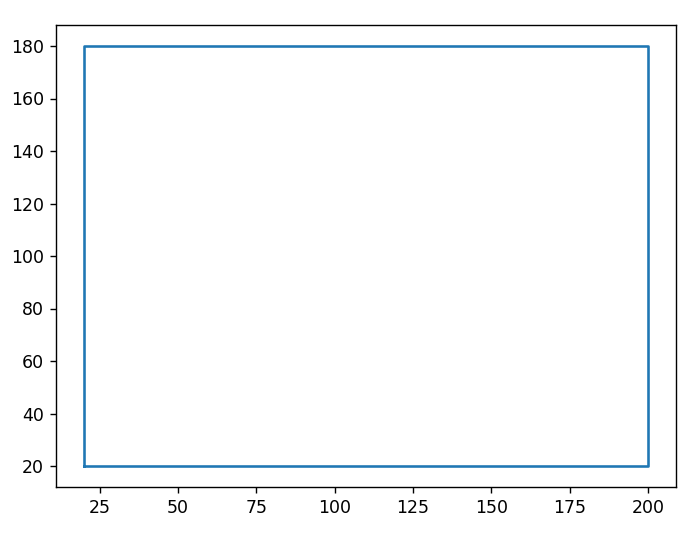
poly = Polygon([(20, 20), (200, 20), (200, 180), (20, 180)])
x, y = poly.exterior.xy
ax.plot(x, y)
plt.show()
Lets take a look at our output.
Plotting Polygons with Interiors (holes)
A common problem that we face is when we are plotting polygons with interiors. This is because the technique we normally use to retrieve coordinates, is the exterior attribute. As the name implies, this does not include the interior coordinates.
The below code demonstrates how to overcome this problem by iterating over all the interiors, retrieving their coordinates and plotting them.
import matplotlib.pyplot as plt
from shapely.geometry import Polygon
fig, ax = plt.subplots()
# Create Polygon
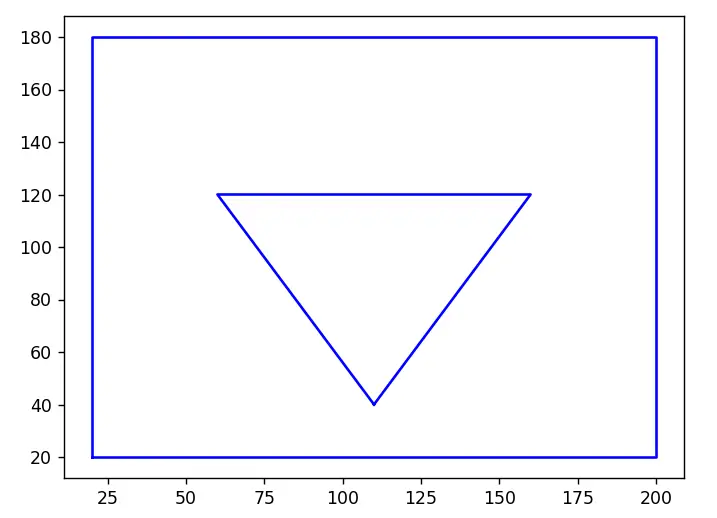
exterior = [(20, 20), (200, 20), (200, 180), (20, 180)]
interior = [(110, 40), (60, 120), (160, 120)]
poly = Polygon(exterior, holes=[interior])
# Plot Polygon
xe, ye = poly.exterior.xy
interior_coords = []
if poly.interiors: # If there are any Interiors
# Retrieve coordinates for all interiors
for inner in poly.interiors:
interior_coords += inner.coords[:]
xi, yi = zip(*interior_coords)
ax.plot(xe, ye, xi, yi, color="blue")
plt.show()
As you can see from our output, our Polygon has a “hole” inside it in the shape of a Triangle.
For more information and examples on Plotting interiors in Shapely, follow this link.
Plot Shapely Multi-Polygons with Matplotlib
Another barrier that we often face is plotting Multi-Polygons. These are basically a collection of regular Polygons, that do not intersect/overlap with each other. Luckily, the process of handling them is not very difficult.
There are multiple approaches that we can take, but the one shown below is by far the easiest.
import matplotlib.pyplot as plt
from shapely.geometry import Polygon, MultiPolygon
import pandas

fig, ax = plt.subplots()

# Create Polygon
poly_1 = Polygon([(10, 10), (13, 12), (5, 10), (3, 4)])
poly_2 = Polygon([(20, 20), (28, 16), (25, 7), (18, 19)])
poly_3 = Polygon([(2, 20), (6, 23), (16, 18), (12, 13)])
polygons = MultiPolygon([poly_1, poly_2, poly_3])

# Plot Polygon
for poly in polygons.geoms:
    xe, ye = poly.exterior.xy
    ax.plot(xe, ye, color="blue")

plt.show()
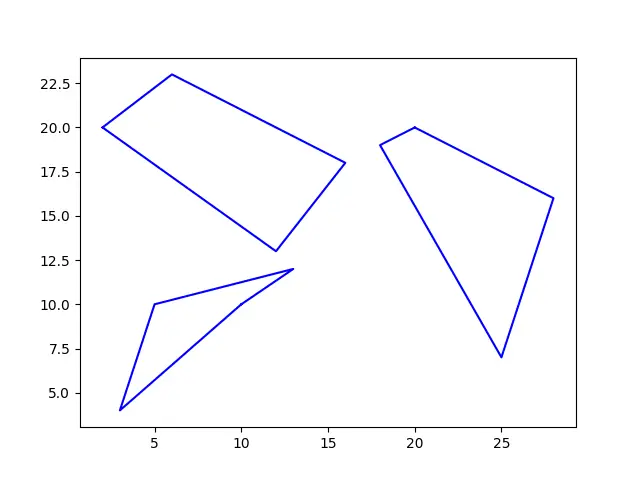
Keep in mind however, that the Polygons in our Multi-polygons do not have holes, neither have we accounted for them in our code.
You can easily rectify this by combining our approach from before for the interiors with the above code. For more information and similar examples, refer to our complete tutorial on Plotting Shapely Multi-Polygons in Matplotlib.
This marks the end of the Plot shapely polygons with Matplotlib Tutorial. Any suggestions or contributions for CodersLegacy are more than welcome. Questions regarding the tutorial content can be asked in the comments section below.