
A common problem that we face is when we are trying to plot Shapely polygons with interiors (holes). But first, what is an interior?
Take a look at the following Polygon.
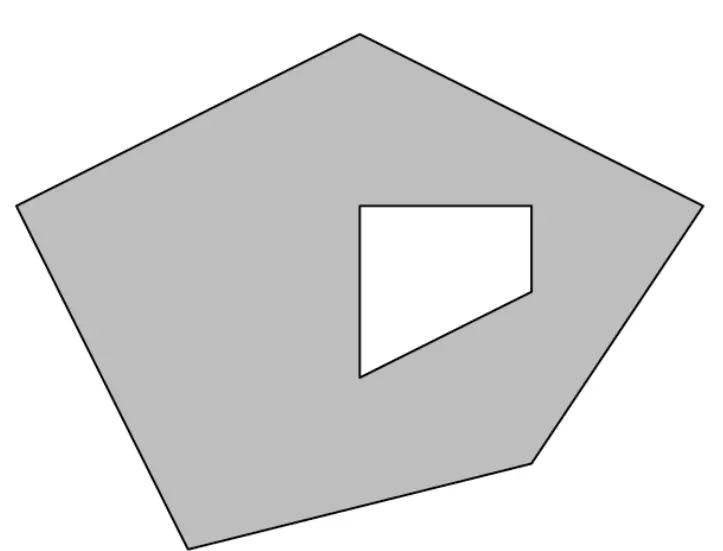
This polygon is not completely filed, and has what we call a “hole” or “interior” as its referred to in Shapely. In this Shapely tutorial, we will explain a common problem that people face when plotting Polygons with holes, and how to easily solve it.
Plotting Polygons with Interiors (holes)
Let us start by plotting a simply Polygon (no interiors) as a quick recap from previous lessons.
import matplotlib.pyplot as plt
from shapely.geometry import Polygon

fig, ax = plt.subplots()

# Create Polygon
exterior = [(20, 20), (50, 70), (80, 20)]
poly = Polygon(exterior)

# Plot Polygon
xe, ye = poly.exterior.xy

ax.plot(xe, ye, color="blue")
ax.axis([0, 100, 0, 100])
plt.show()
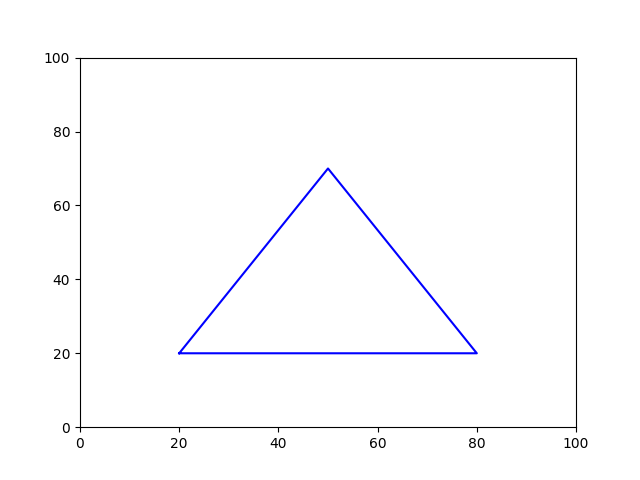
The key point here is to remember that we use the .exterior attribute to retrieve the coordinates from the Polygon. This obviously does not work for interiors.
Note: We will be using Matplotlib to visualize our Shapely polygons so that you can get a better understanding of how it looks. You don’t actually need matplotlib if you just want Shapely polygons for calculation purposes.
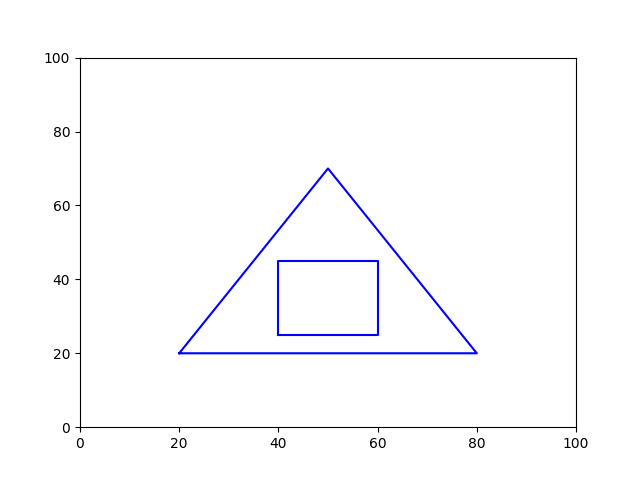
Here is the same code from above, but this time we have added an “interior” into our Plot. Hence, we have also modified the code accordingly.
We usually have a separate list of values with the interior values (there can be more than one interior list). We then pass a list of interior lists to the holes parameter in the Polygon Class. In other words, we need to pass a 2D array to the holes parameter.
import matplotlib.pyplot as plt
from shapely.geometry import Polygon

fig, ax = plt.subplots()

# Create Polygon
exterior = [(20, 20), (50, 70), (80, 20)]
interior = [(40, 25), (40, 45), (60, 45), (60, 25)]
poly = Polygon(exterior, holes=[interior])

# Plot Polygon
xe, ye = poly.exterior.xy

# If there are any Interiors
# Retrieve coordinates for all interiors
for inner in poly.interiors:
    xi, yi = zip(*inner.coords[:])
    ax.plot(xi, yi, color="blue")

ax.plot(xe, ye, color="blue")
ax.axis([0, 100, 0, 100])
plt.show()
The best thing about this, is that it works for both simple Polygons and Polygons with interiors, because we first check to see if there are interiors before executing any interior-specific code.
Lets focus a bit more on the interior-related part of the code.
# If there are any Interiors
# Retrieve coordinates for all interiors
for inner in poly.interiors:
    xi, yi = zip(*inner.coords[:])
    ax.plot(xi, yi, color="blue")
Here we are iterating over all the interiors in our for loop (because there may be more than one). We then retrieve the coordinate pairs from each interior using the .coords attribute.
Now we need to somehow extract the x and y values into two separate lists containing x values and y values respectively. Using the zip() function and the unpacking operator * we can convert our coordinate array from this…
[(40.0, 25.0), (40.0, 45.0), (60.0, 45.0), (60.0, 25.0), (40.0, 25.0)]to this.
(40.0, 40.0, 60.0, 60.0, 40.0) (25.0, 45.0, 45.0, 25.0, 25.0)We can now pass these two lists into our plot() function and matplotlib will take care of the rest.
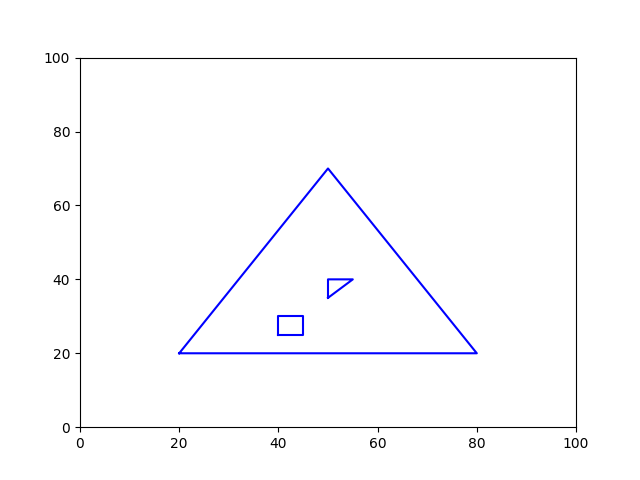
Polygons with Multiple Interiors
Lets take a look at a more complex example which involves multiple interiors. We don’t need to make adjustments to our code as it handles all possible cases. Let us demonstrate this to you with another example.
import matplotlib.pyplot as plt
from shapely.geometry import Polygon

fig, ax = plt.subplots()

# Create Polygon
exterior =  [(20, 20), (50, 70), (80, 20)]
interiors=  [[(40, 25), (40, 30), (45, 30), (45, 25)],
             [(50, 35), (50, 40), (55, 40)]]

poly = Polygon(exterior, holes=interiors)

# Plot Polygon
xe, ye = poly.exterior.xy

if poly.interiors:   # If there are any Interiors
    # Retrieve coordinates for all interiors
    for inner in poly.interiors:
        xi, yi = zip(*inner.coords[:])
        ax.plot(xi, yi, color="blue")

print(xi, yi)
ax.plot(xe, ye, color="blue")
ax.axis([0, 100, 0, 100])
plt.show()
Plotting Holes/Interiors with Solid Color
One problem with the above output, is that the interiors look a bit out of place. This is due to a lack of proper coloring. In this section we will show you a handy function that can be used to plot polygons with solid color fill.
This technique will work on Polygons of all types, whether they have interior(s) or not.
def plot_polygon(ax, poly, **kwargs):
    path = Path.make_compound_path(
           Path(np.asarray(poly.exterior.coords)[:, :2]),
           *[Path(np.asarray(ring.coords)[:, :2]) for ring in poly.interiors])

    patch = PathPatch(path, **kwargs)
    collection = PatchCollection([patch], **kwargs)

    ax.add_collection(collection, autolim=True)
    ax.autoscale_view()
    return collection
You don’t really need to understand what’s going on here. All you need to do is provide it with the axis object and the polygon and it will plot it for you. You can also pass in a bunch of extra parameters to customize it a bit.
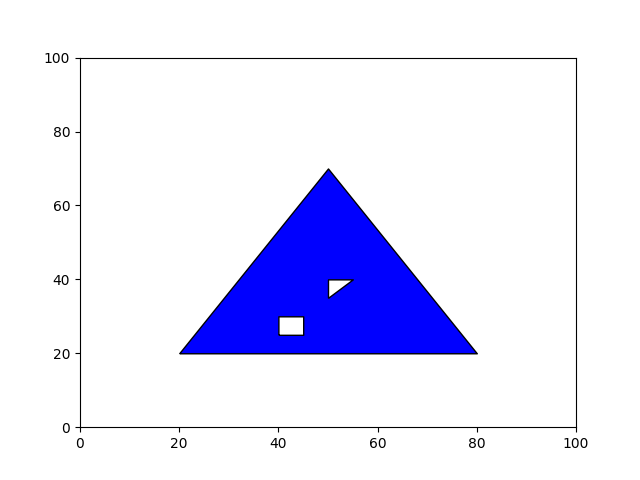
Here is the complete code with some output. Keep in mind that there are several more imports to make.
import matplotlib.pyplot as plt
from matplotlib.path import Path
from matplotlib.patches import PathPatch
from matplotlib.collections import PatchCollection
from shapely.geometry import Polygon
import numpy as np

def plot_polygon(ax, poly, **kwargs):
    path = Path.make_compound_path(
           Path(np.asarray(poly.exterior.coords)[:, :2]),
           *[Path(np.asarray(ring.coords)[:, :2]) for ring in poly.interiors])

    patch = PathPatch(path, **kwargs)
    collection = PatchCollection([patch], **kwargs)

    ax.add_collection(collection, autolim=True)
    ax.autoscale_view()
    return collection

fig, ax = plt.subplots()

# Create Polygon
exterior =  [(20, 20), (80, 20), (50, 70)]
interiors=  [[(40, 25), (40, 30), (45, 30), (45, 25)],
             [(50, 35), (50, 40), (55, 40)]]
poly = Polygon(exterior, holes=interiors)

plot_polygon(ax, poly, facecolor="blue", edgecolor="black")

ax.axis([0, 100, 0, 100])
plt.show()
If you want to understand how this was done, you need to learn about Matplotlib Paths and Patches.
Note: There is one condition required for this code for plotting the interiors (holes) using the above method. Your exterior coordinates must be counter-clockwise order, and the interior coordinates must be in clockwise-order (starting point doesn’t really matter).
Once concept we haven’t covered here, is how to create Shapely MultiPolygons. Refer to this Shapely tutorial to learn more.
This marks the end of the Plotting Shapely Polygons with Interiors (holes) Tutorial. Any suggestions or contributions for CodersLegacy are more than welcome. Questions regarding the tutorial content can be asked in the comments section below.
hi,
thank you for post
I do not understand the algorithm , why following code does not work ?
exterior = [(20, 20), (50, 70), (80, 20)]