
Take your graphs and plots to the next level using Matplotlib’s 3D capabilities! In this tutorial we will be demonstrating how to make 3D Plots and Graphs in Python Matplotlib!
There are six 3D Plots that we will be discussing today:
- Bar Graph
- Scatter Plot
- Wireframe Plot
- Surface Plot
- Contour Plot
- Quiver Plot
3D Bar Graph
A Bar Chart/Graph is one of the most popular plots used to represent data. For most purposes, we use a 2D Bar chart that allows us to compare two sets of values at the same time (the x-axis and y-axis). However, sometimes we wish to simultaneously compare three sets of values/data, and that is where the 3D Bar Chart comes in.
import matplotlib.pyplot as plt
import numpy as np

fig = plt.figure()
ax = plt.axes(projection = "3d")

countries = [" ","Australia", " ","Brazil", " ","Canada", " ","France"]
data = np.array([[1.8, 20.4, 2.1, 1.6],
                 [1.3, 18.1, 1.2, 2.3],
                 [0.8, 27.8, 1.4, 1.3]])
years = [None, None, 2005, None, 2010, None, 2015]

numOfCols = 4
numOfRows = 3

xpos = np.arange(0, numOfCols, 1)
ypos = np.arange(0, numOfRows, 1)
xpos, ypos = np.meshgrid(xpos + 0.5, ypos + 0.5)

xpos = xpos.flatten()
ypos = ypos.flatten()
zpos = np.zeros(numOfCols * numOfRows)

dx = np.ones(numOfRows * numOfCols) * 0.5
dy = np.ones(numOfCols * numOfRows) * 0.5
dz = data.flatten()

ax.bar3d(xpos, ypos, zpos, dx, dy, dz)
ax.set_xticklabels(countries)
ax.set_yticklabels(years)

ax.set_xlabel('Countries')
ax.set_ylabel('Over the years')
ax.set_zlabel('Number of Homicide cases')

plt.show()

Does it look complicated? Well yes, it can be if you don’t understand it. Check out this tutorial that walks you through the code step-by-step.
Don’t worry, the rest of the 3D Plots are much easier!
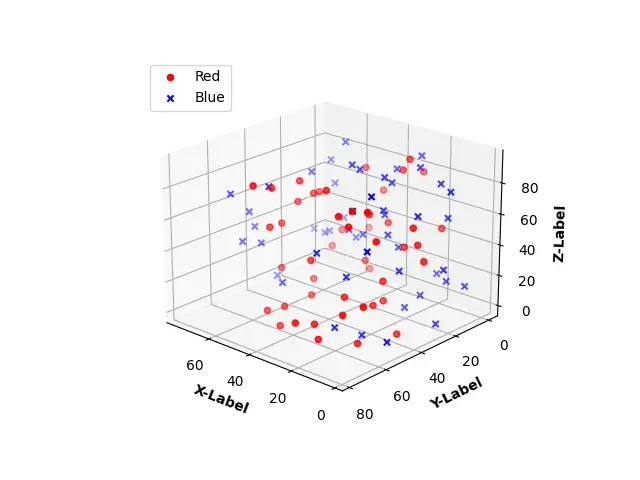
3D Scatter Plot
A scatter plot (i.e. Scatter graph or Scatter Chart) is a plot which displays a collection of points, plotted as Cartesian coordinates. The “points” represent the values of two or more variables. Scatter plots with two variables, whose values are plotted along the X and Y axis are known as 2D Scatter plots. Those plots with three variables, with values plotted along the X, Y and Z axis are known as 3D Scatter plots.
import numpy as np
import matplotlib.pyplot as plt
from mpl_toolkits import mplot3d

fig = plt.figure()
ax = plt.axes(projection="3d")

# Creating dataset
x = np.random.randint(0, 60,  size =(50))
y = np.random.randint(0, 80,  size =(50))
z = np.random.randint(0, 100, size =(50))
ax.scatter(x, y, z, color = 'red', marker = 'o', label = "Red")

# Creating dataset-2
x = np.random.randint(0, 80,  size =(50))
y = np.random.randint(0, 60,  size =(50))
z = np.random.randint(0, 90,  size =(50))
ax.scatter(x, y, z, color = 'blue', marker = 'x', label = "Blue")

ax.set_xlabel('X-Label', fontweight ='bold')
ax.set_ylabel('Y-Label', fontweight ='bold')
ax.set_zlabel('Z-Label', fontweight ='bold')
ax.legend(loc='upper left')

plt.show()
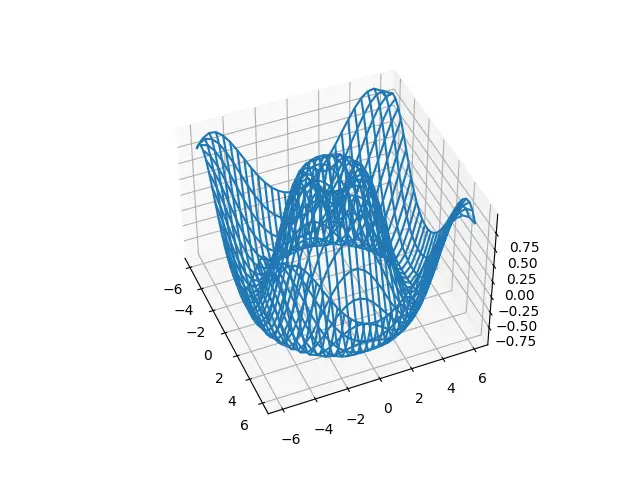
3D Wireframe
A Wireframe is special type of 3D plot in Matplotlib, used for the representation of 3D Data. It helps you visualize what the data looks, through a series of “wires” or “lines”, which can be straight as well as curved.
import matplotlib.pyplot as plt
import numpy as np

def f(x, y):
    return np.sin(np.sqrt(x ** 2 + y ** 2))

x = np.linspace(-6, 6, 30)
y = np.linspace(-6, 6, 30)

X, Y = np.meshgrid(x, y)
Z = f(X, Y)

fig = plt.figure()
ax = plt.axes(projection = "3d")

ax.plot_wireframe(X, Y, Z)
plt.show()
3D Surface Plot
A Surface Plot is a representation of three-dimensional data, used to observe the relation between two independent variables (X and Z), and one dependent variable (Y). A Surface Plot is 3D in nature, and today we will explore how to create them using Matplotlib.
from matplotlib import cm
import matplotlib.pyplot as plt
import numpy as np

def f(x, y):
    return np.sqrt( np.sqrt(x**2) + np.sqrt(y**2) )

x = np.linspace(-3, 3, 30)
y = np.linspace(-3, 3, 30)
X, Y = np.meshgrid(x, y)
Z = f(X, Y)

fig = plt.figure()
ax = plt.axes(projection = "3d")

plot = ax.plot_surface(X, Y, Z, cmap = cm.coolwarm)
fig.colorbar(plot, shrink = 0.8)
plt.show()

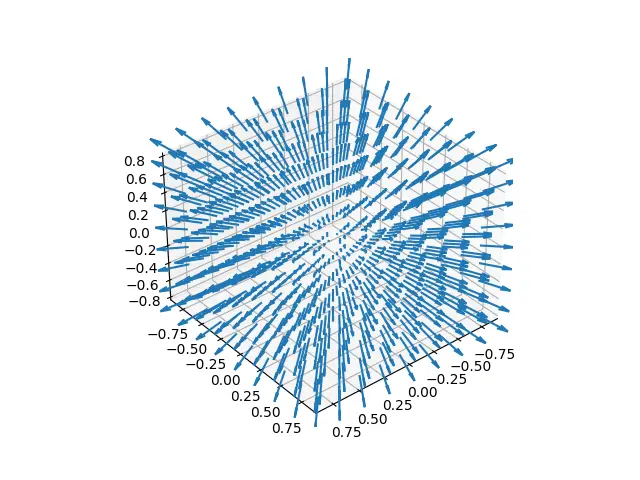
3D Quiver Plot
Quiver Plots are used to represent data that requires a direction. For example, electric and magnetic fields comprise of many individual vectors each with their own direction. The Matplotlib Quiver Plot is used to plot these individual vectors and construct the entire field/flow.
import matplotlib.pyplot as plt
import numpy as np

# Coordinates (x,y,z)
x, y, z = np.meshgrid(np.arange(-0.8, 1, 0.2),
                      np.arange(-0.8, 1, 0.2),
                      np.arange(-0.8, 1, 0.2))

# Direction of the Arrows (vectors)
u = np.sin(x)
v = np.sin(y)
w = np.sin(z)

fig = plt.figure()
ax = plt.axes(projection = "3d")

q = ax.quiver(x,y,z,u,v,w, length = 0.25)
plt.show()
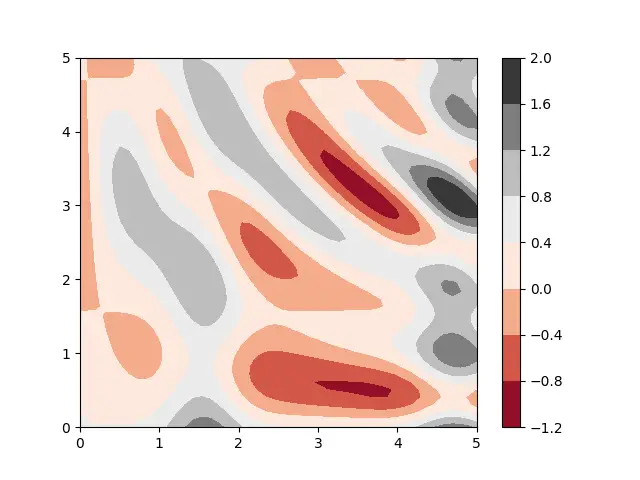
3D Contour Plot
Contour Plots are a special type of Graph used to represent 3D Surfaces on a two-dimensional plane. It works by taking “slices” of the 3D Surface, and drawing corresponding lines on the 2D Plane. Today’s tutorial will be demonstrating how we can create Contour Plots using the Python Library Matplotlib.
import matplotlib.pyplot as plt
import numpy as np

def f(x, y):
    return np.sin(x) ** 8 + np.cos(20 + y * x) * np.cos(y)

x = np.linspace(0, 5, 50)
y = np.linspace(0, 5, 50)
X, Y = np.meshgrid(x, y)
Z = f(X, Y)

fig, ax = plt.subplots()

plt.contourf(X, Y, Z, cmap='RdGy')
plt.colorbar()
plt.show()
This marks the end of the 3D Plots and Graphs in Python Matplotlib Tutorial. Any suggestions or contributions for CodersLegacy are more than welcome. Questions regarding the tutorial content can be asked in the comments section below.